Skip to content
MathsGenie logo
Quick links
Open app

Course home

  1. A Level
  2. Economics Edexcel A
  3. Question bank

1.2 How markets work

EasyMediumHard
1234567891011121314151617181920212223242526272829303132333435363738394041424344454647484950
Question 21

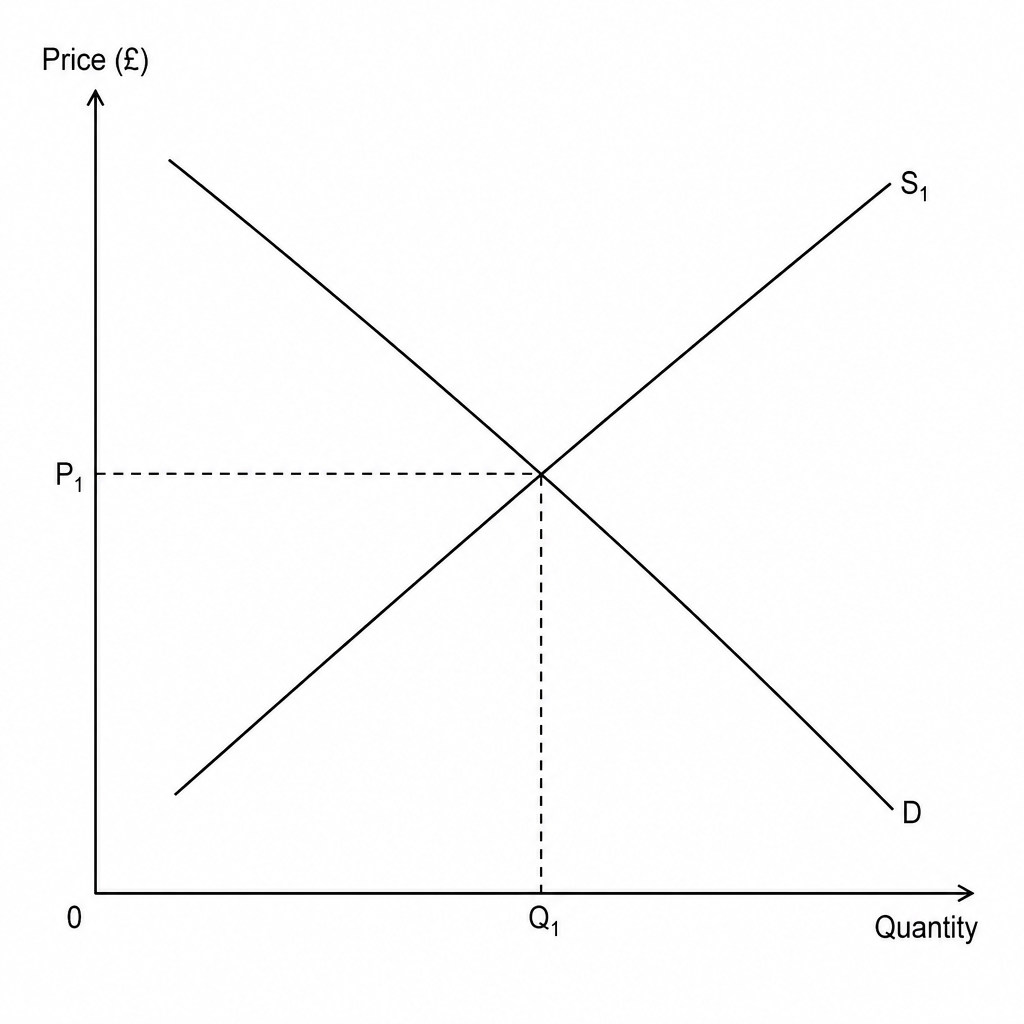
Annotate the diagram below to show the effect of removing a government subsidy for home loft insulation on the market equilibrium price and quantity.

A demand and supply diagram representing the market for home loft insulation. The vertical axis is labeled 'Price (£)' and the horizontal axis is labeled 'Quantity'. A downward-sloping demand curve is labeled 'D'. An upward-sloping supply curve representing the initial subsidized state is labeled 'S1'. The curves intersect at an equilibrium point, with dashed lines leading to 'P1' on the vertical axis and 'Q1' on the horizontal axis. The origin is marked '0'.

[2]

1.2 How markets work Questions

  1. A Level
  2. /Economics
  3. /1.2 How markets work