Defining surplus
Definition
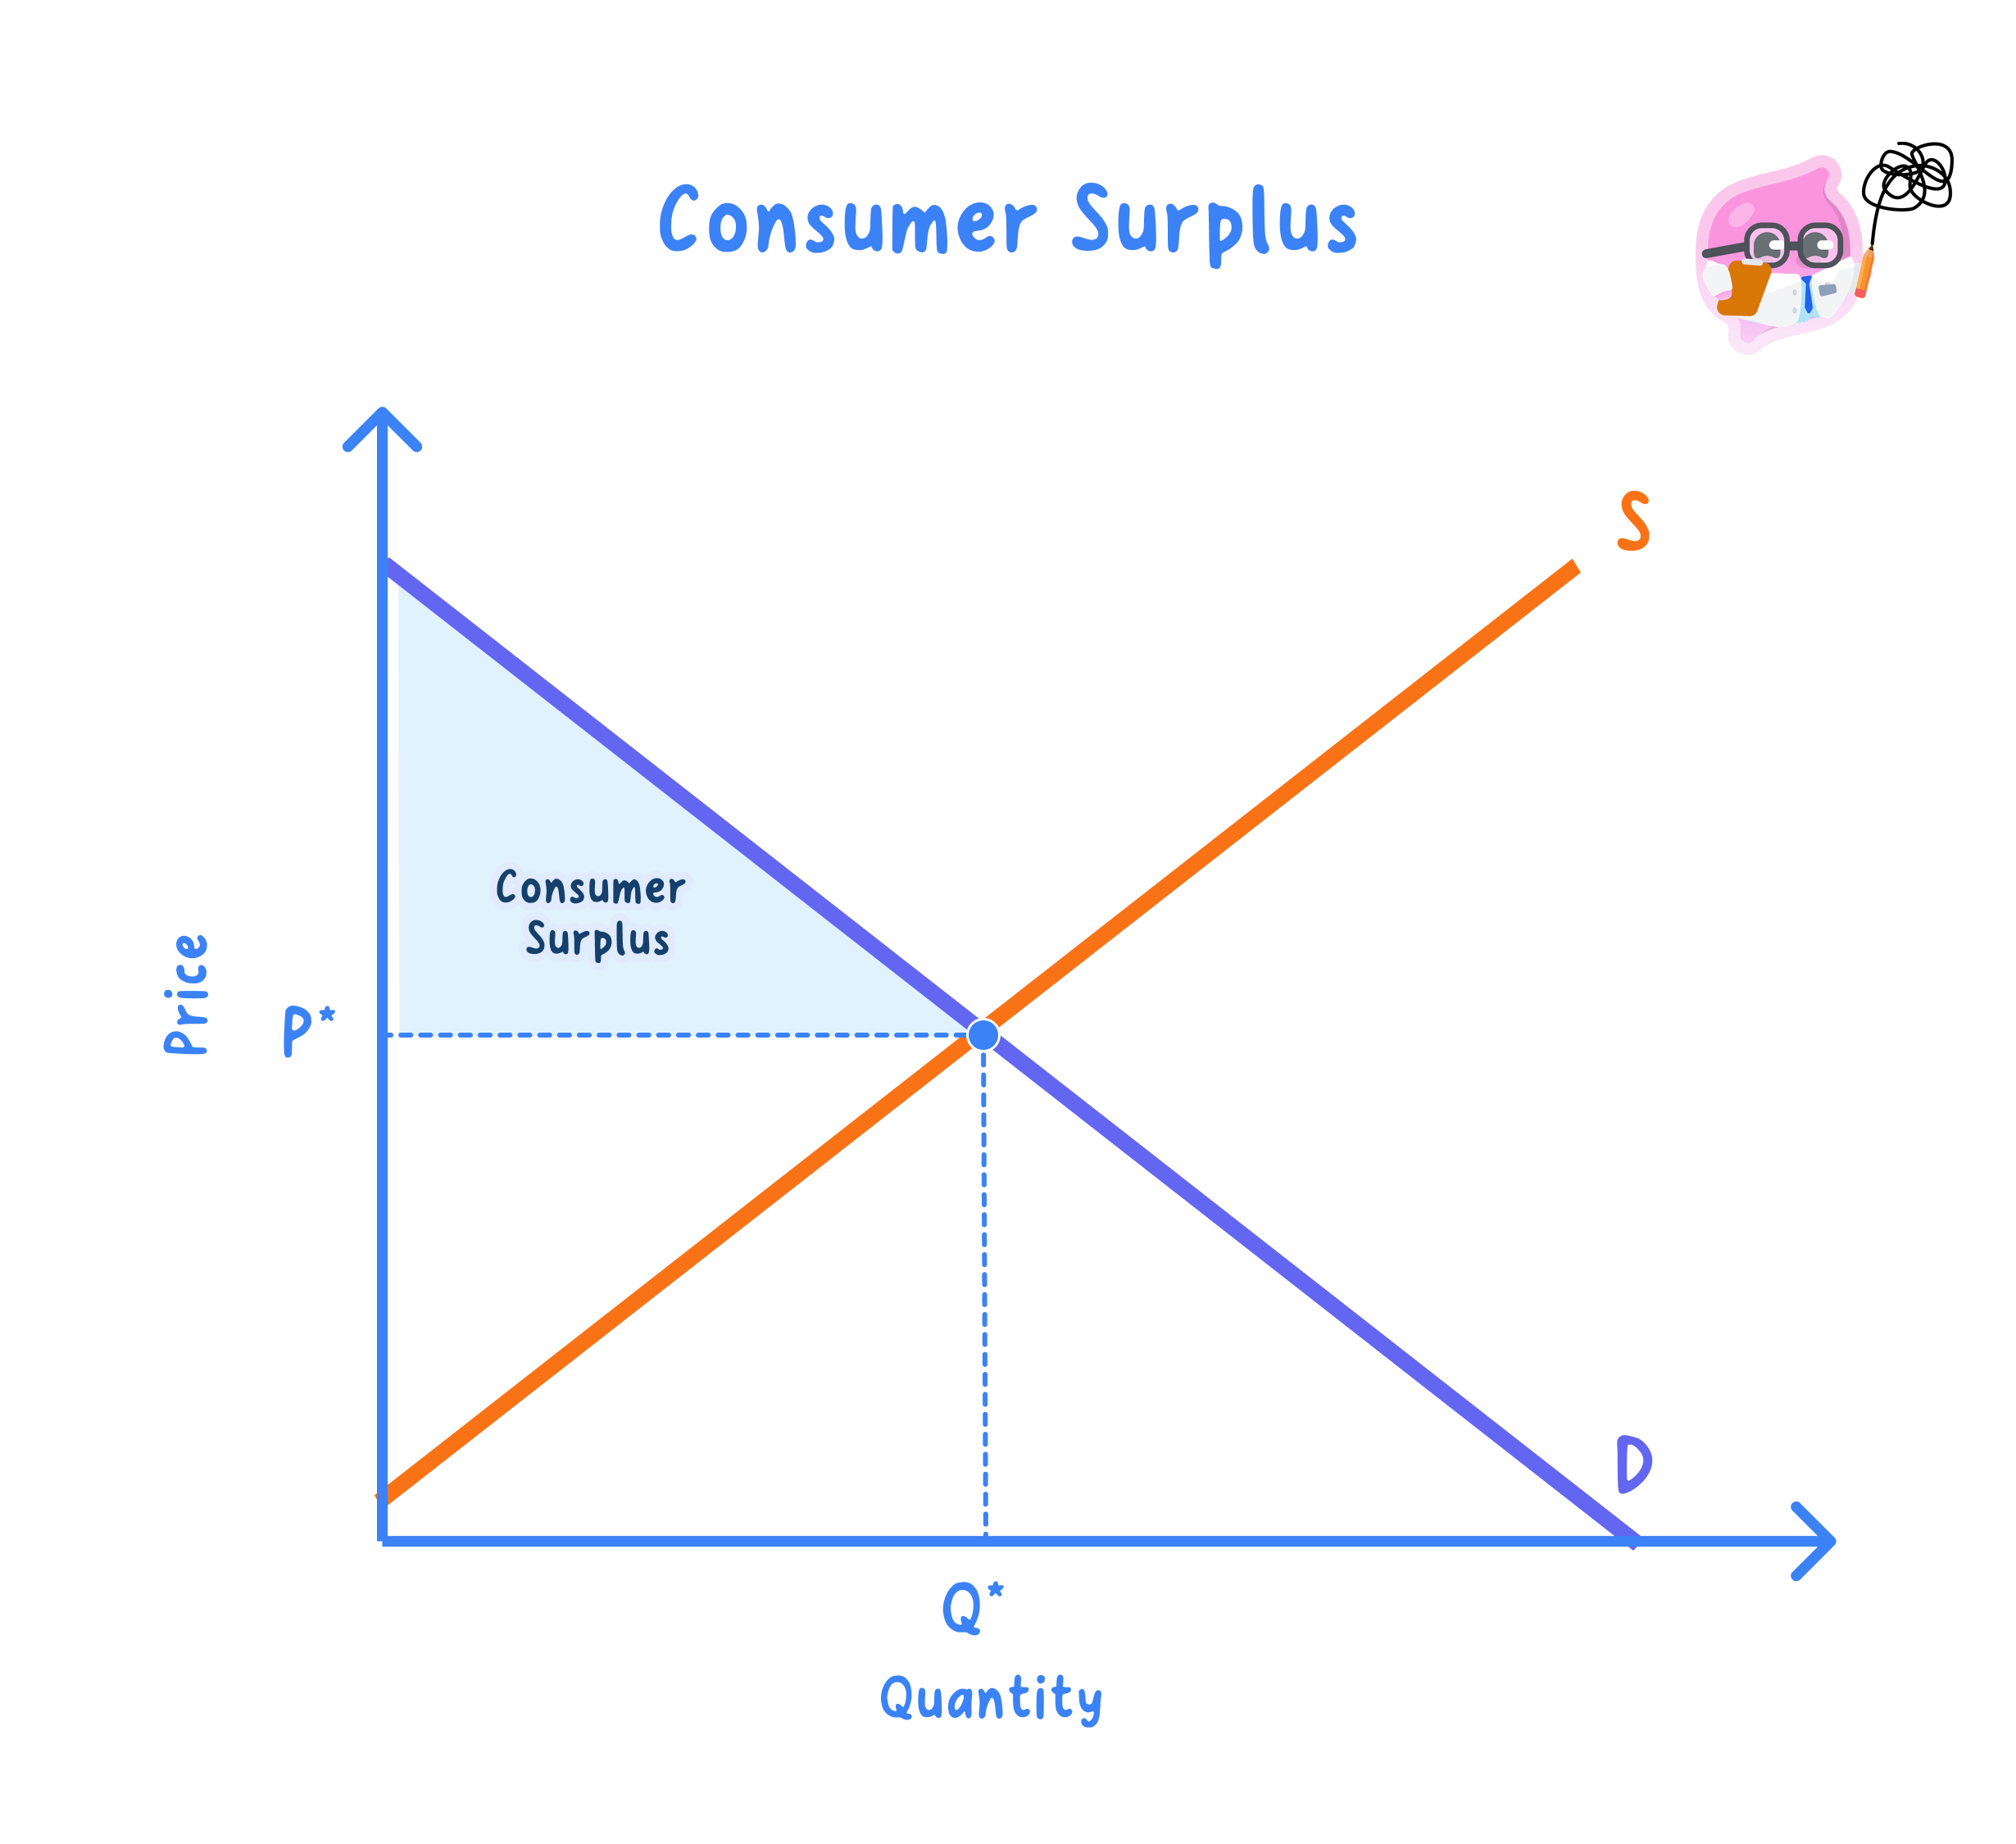
Consumer surplus: the difference between the most buyers are willing to pay and the price they actually pay; on a diagram, the area below the demand curve and above the market price.
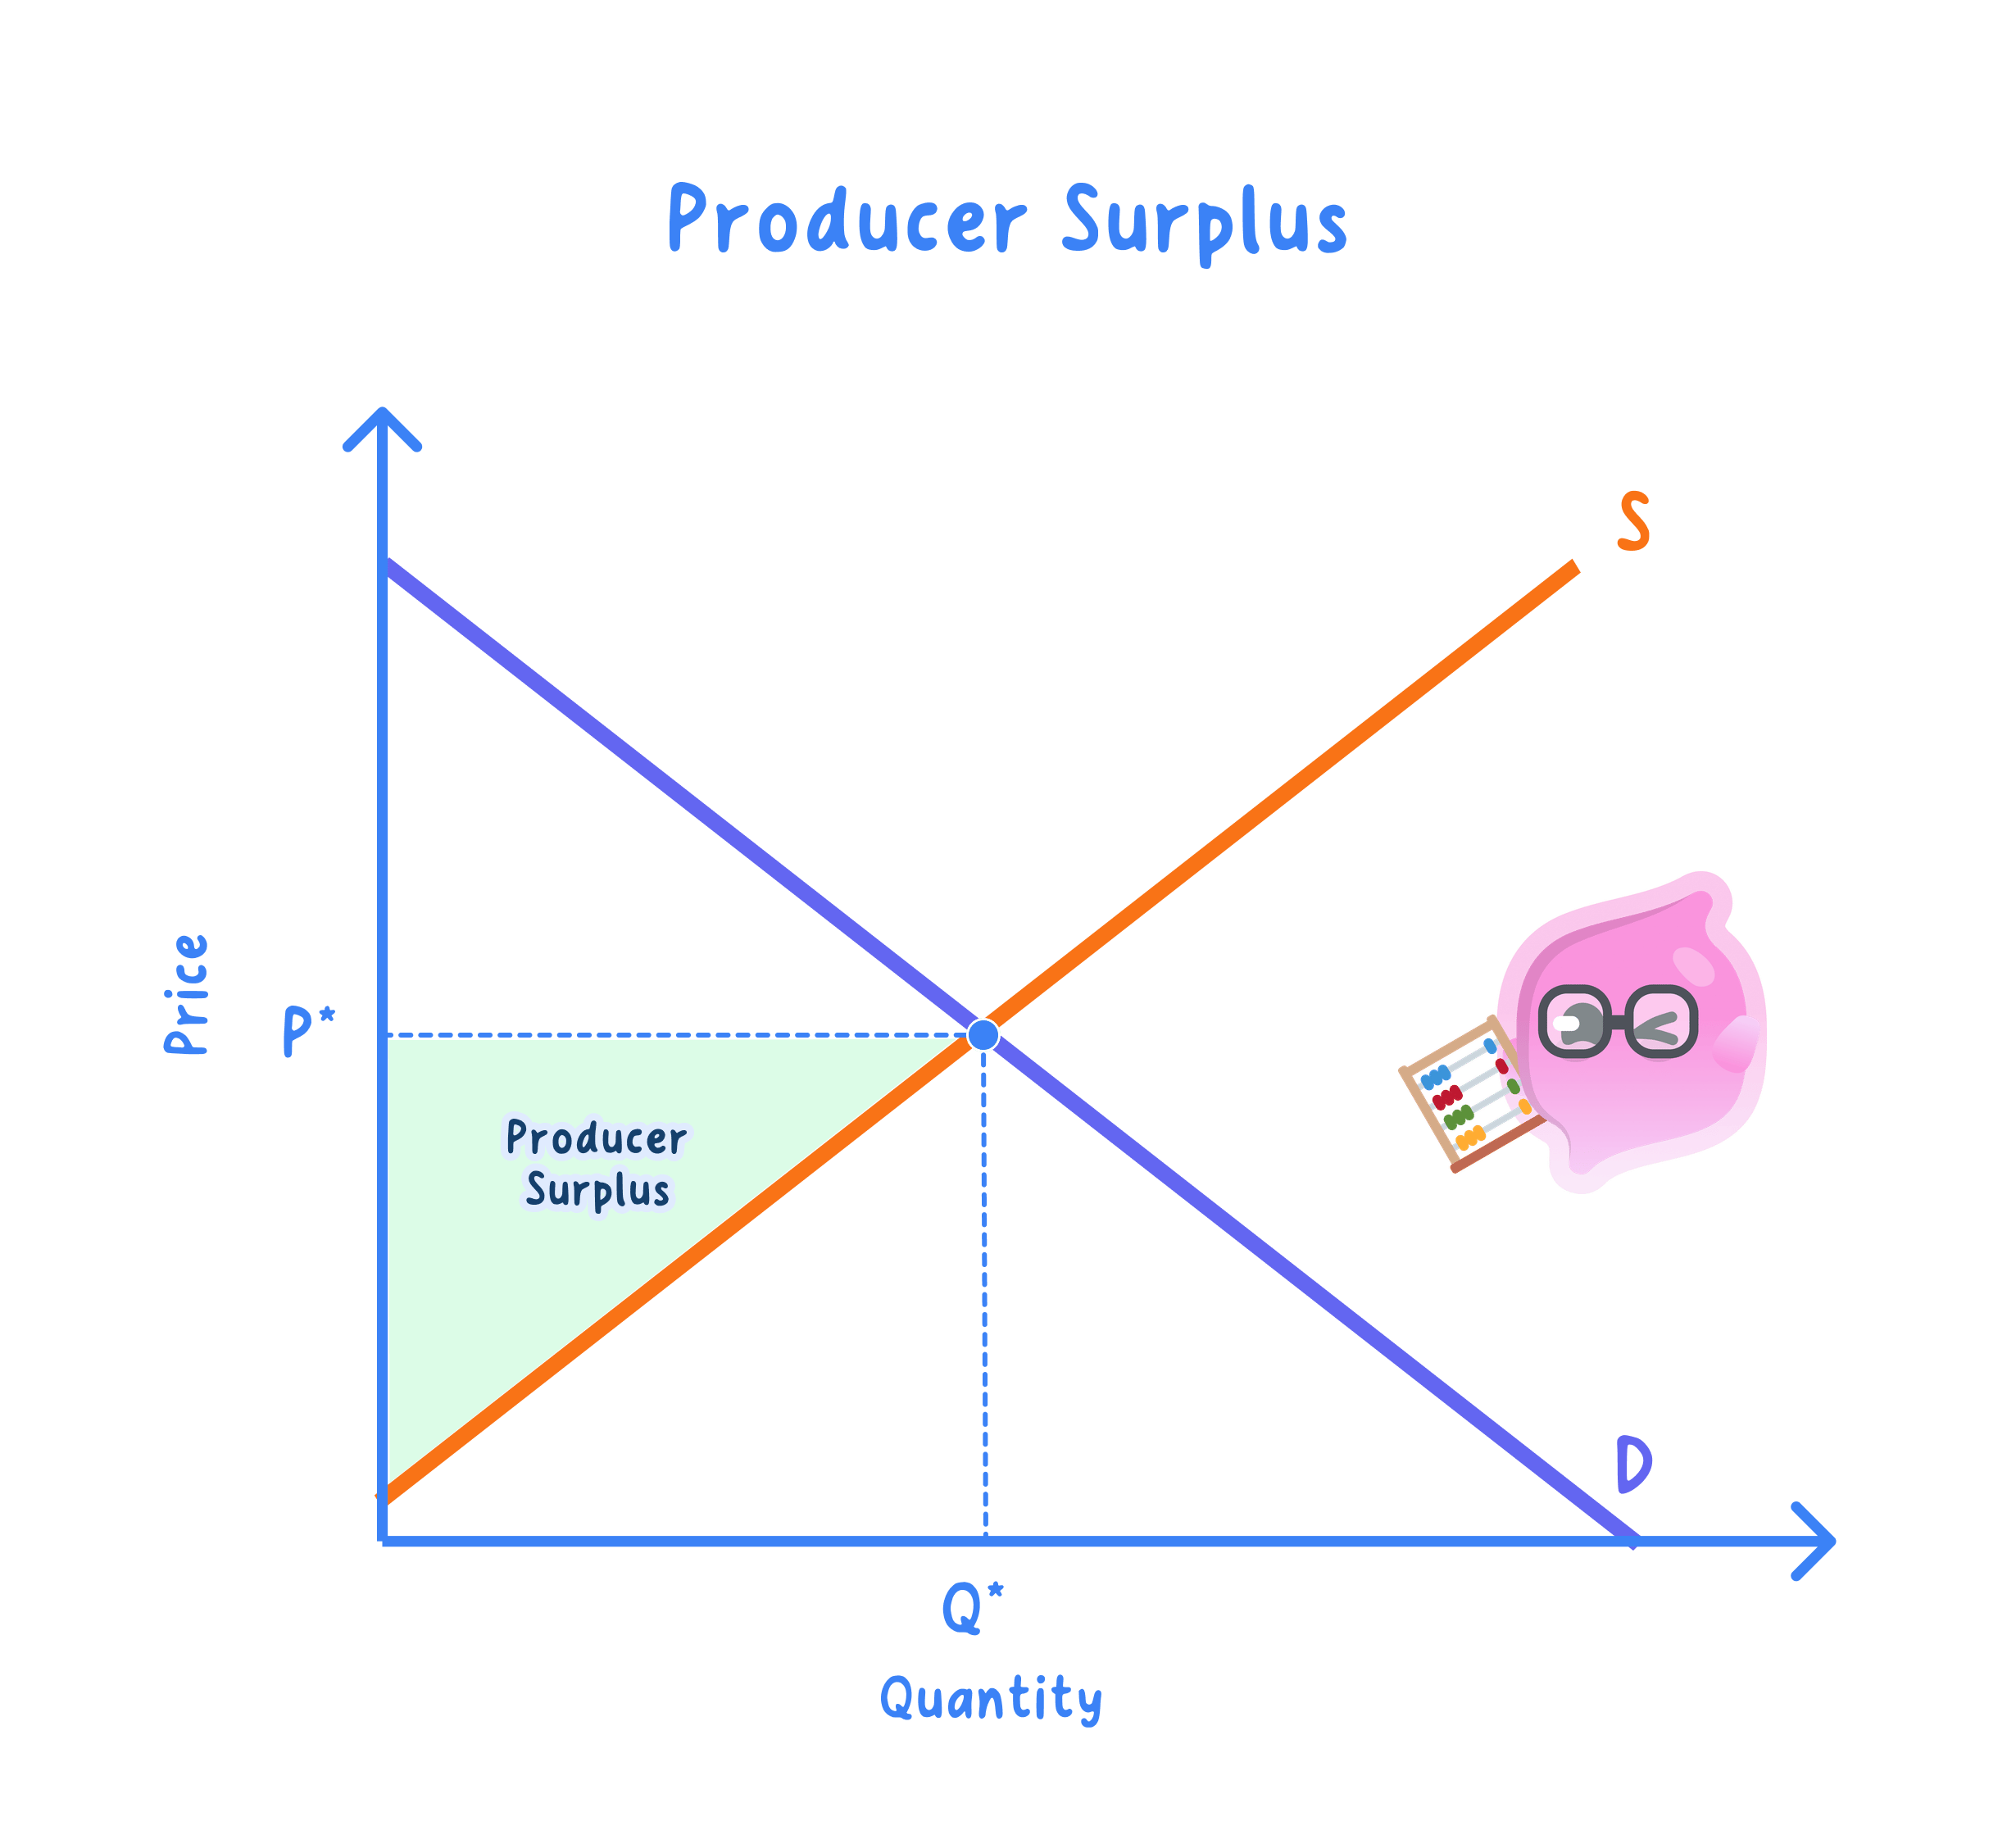
Producer surplus: the difference between the price producers receive and the lowest price they would accept; the area above the supply curve and below the market price.
- The curves read as willingness: the demand curve shows each buyer's maximum willingness to pay and the supply curve each producer's minimum acceptable price, so the gaps up to the market price are the surpluses.
- With price on the vertical axis and quantity on the horizontal axis, each surplus is a triangle resting on the market price line.
Example
- Take a market where the demand curve meets the price axis at £8 and the supply curve at £2, with equilibrium at a price of £5 and a quantity of 100 units.
- A buyer willing to pay £8 but paying the £5 price enjoys £3 of consumer surplus on that unit, and summing across buyers gives the triangle below demand and above £5.
- So consumer surplus is £150 and producer surplus is £75, giving community surplus of £225.
Community surplus
Definition
Community surplus (total welfare): consumer surplus plus producer surplus, the whole area between the demand and supply curves up to the equilibrium quantity.
- Why it peaks at equilibrium: community surplus is largest at the competitive equilibrium, because every unit whose value to buyers exceeds its cost to sellers is traded and none beyond, which is allocative efficiency.
Analogy
- Consumer surplus feels like finding your favourite trainers on sale for £40 when you would happily have paid £60.
- Producer surplus is the shop's gain when it would have sold them for £30 but the market price is £40.
Changes in surplus
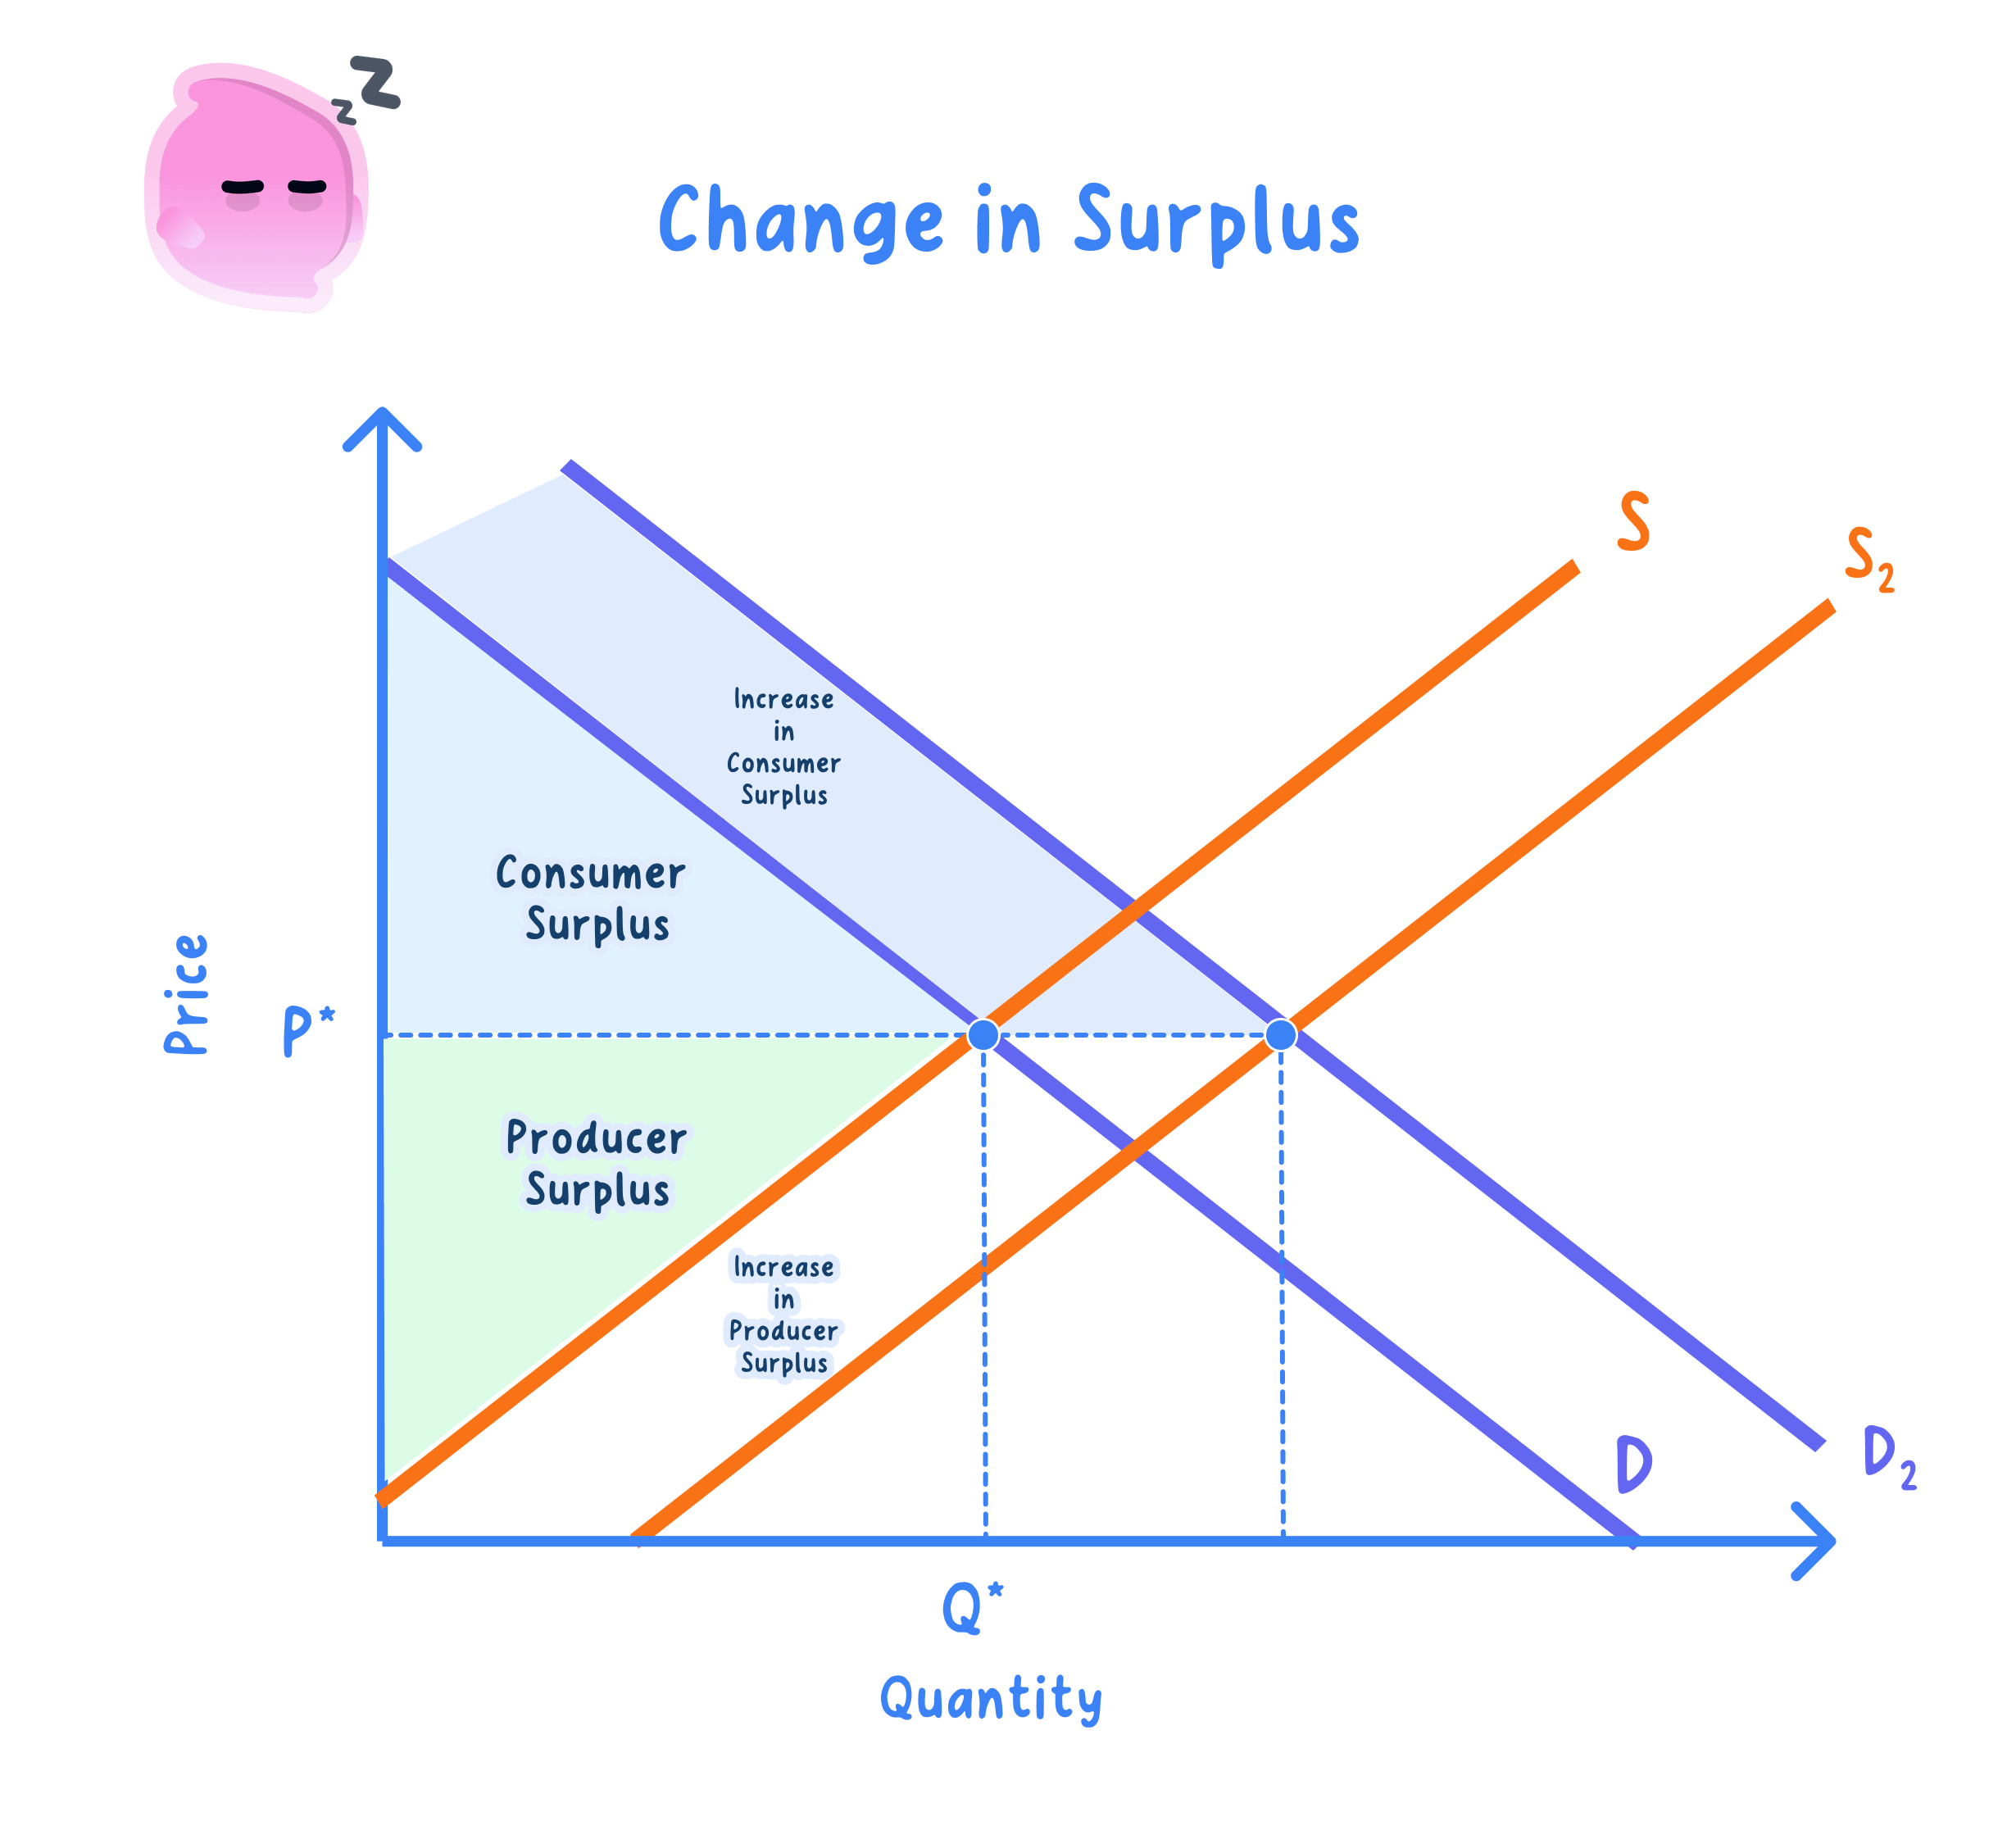
- Price moves split the gains: a fall in price raises consumer surplus and reduces producer surplus, while a rise in price does the reverse.
- An increase in supply lowers the equilibrium price, which raises consumer surplus.
- An increase in demand raises the equilibrium price, which tends to raise producer surplus.
- Elasticity sets the size: the size of each change depends on the price elasticities of demand and supply, because inelastic curves concentrate the change.
Exam technique
- On a labelled diagram, shade consumer surplus below demand and above price, and producer surplus above supply and below price.
- Show the new areas after a shift in demand or supply, or a change in price.
- Link the size of any change to the elasticities of demand and supply.
Common Mistake
- Do not confuse the two: consumer surplus sits below the demand curve, while producer surplus sits above the supply curve.
- Do not treat producer surplus as profit, since it does not net off fixed costs.
- Do not treat the size of a surplus change as fixed, because it depends on elasticity.
Self review
- Define consumer surplus.
- Define producer surplus.
- Where on a diagram is producer surplus shown?
- How does a fall in price change consumer and producer surplus?
- What determines the size of a change in surplus?