Consumer surplus
Consumer surplus
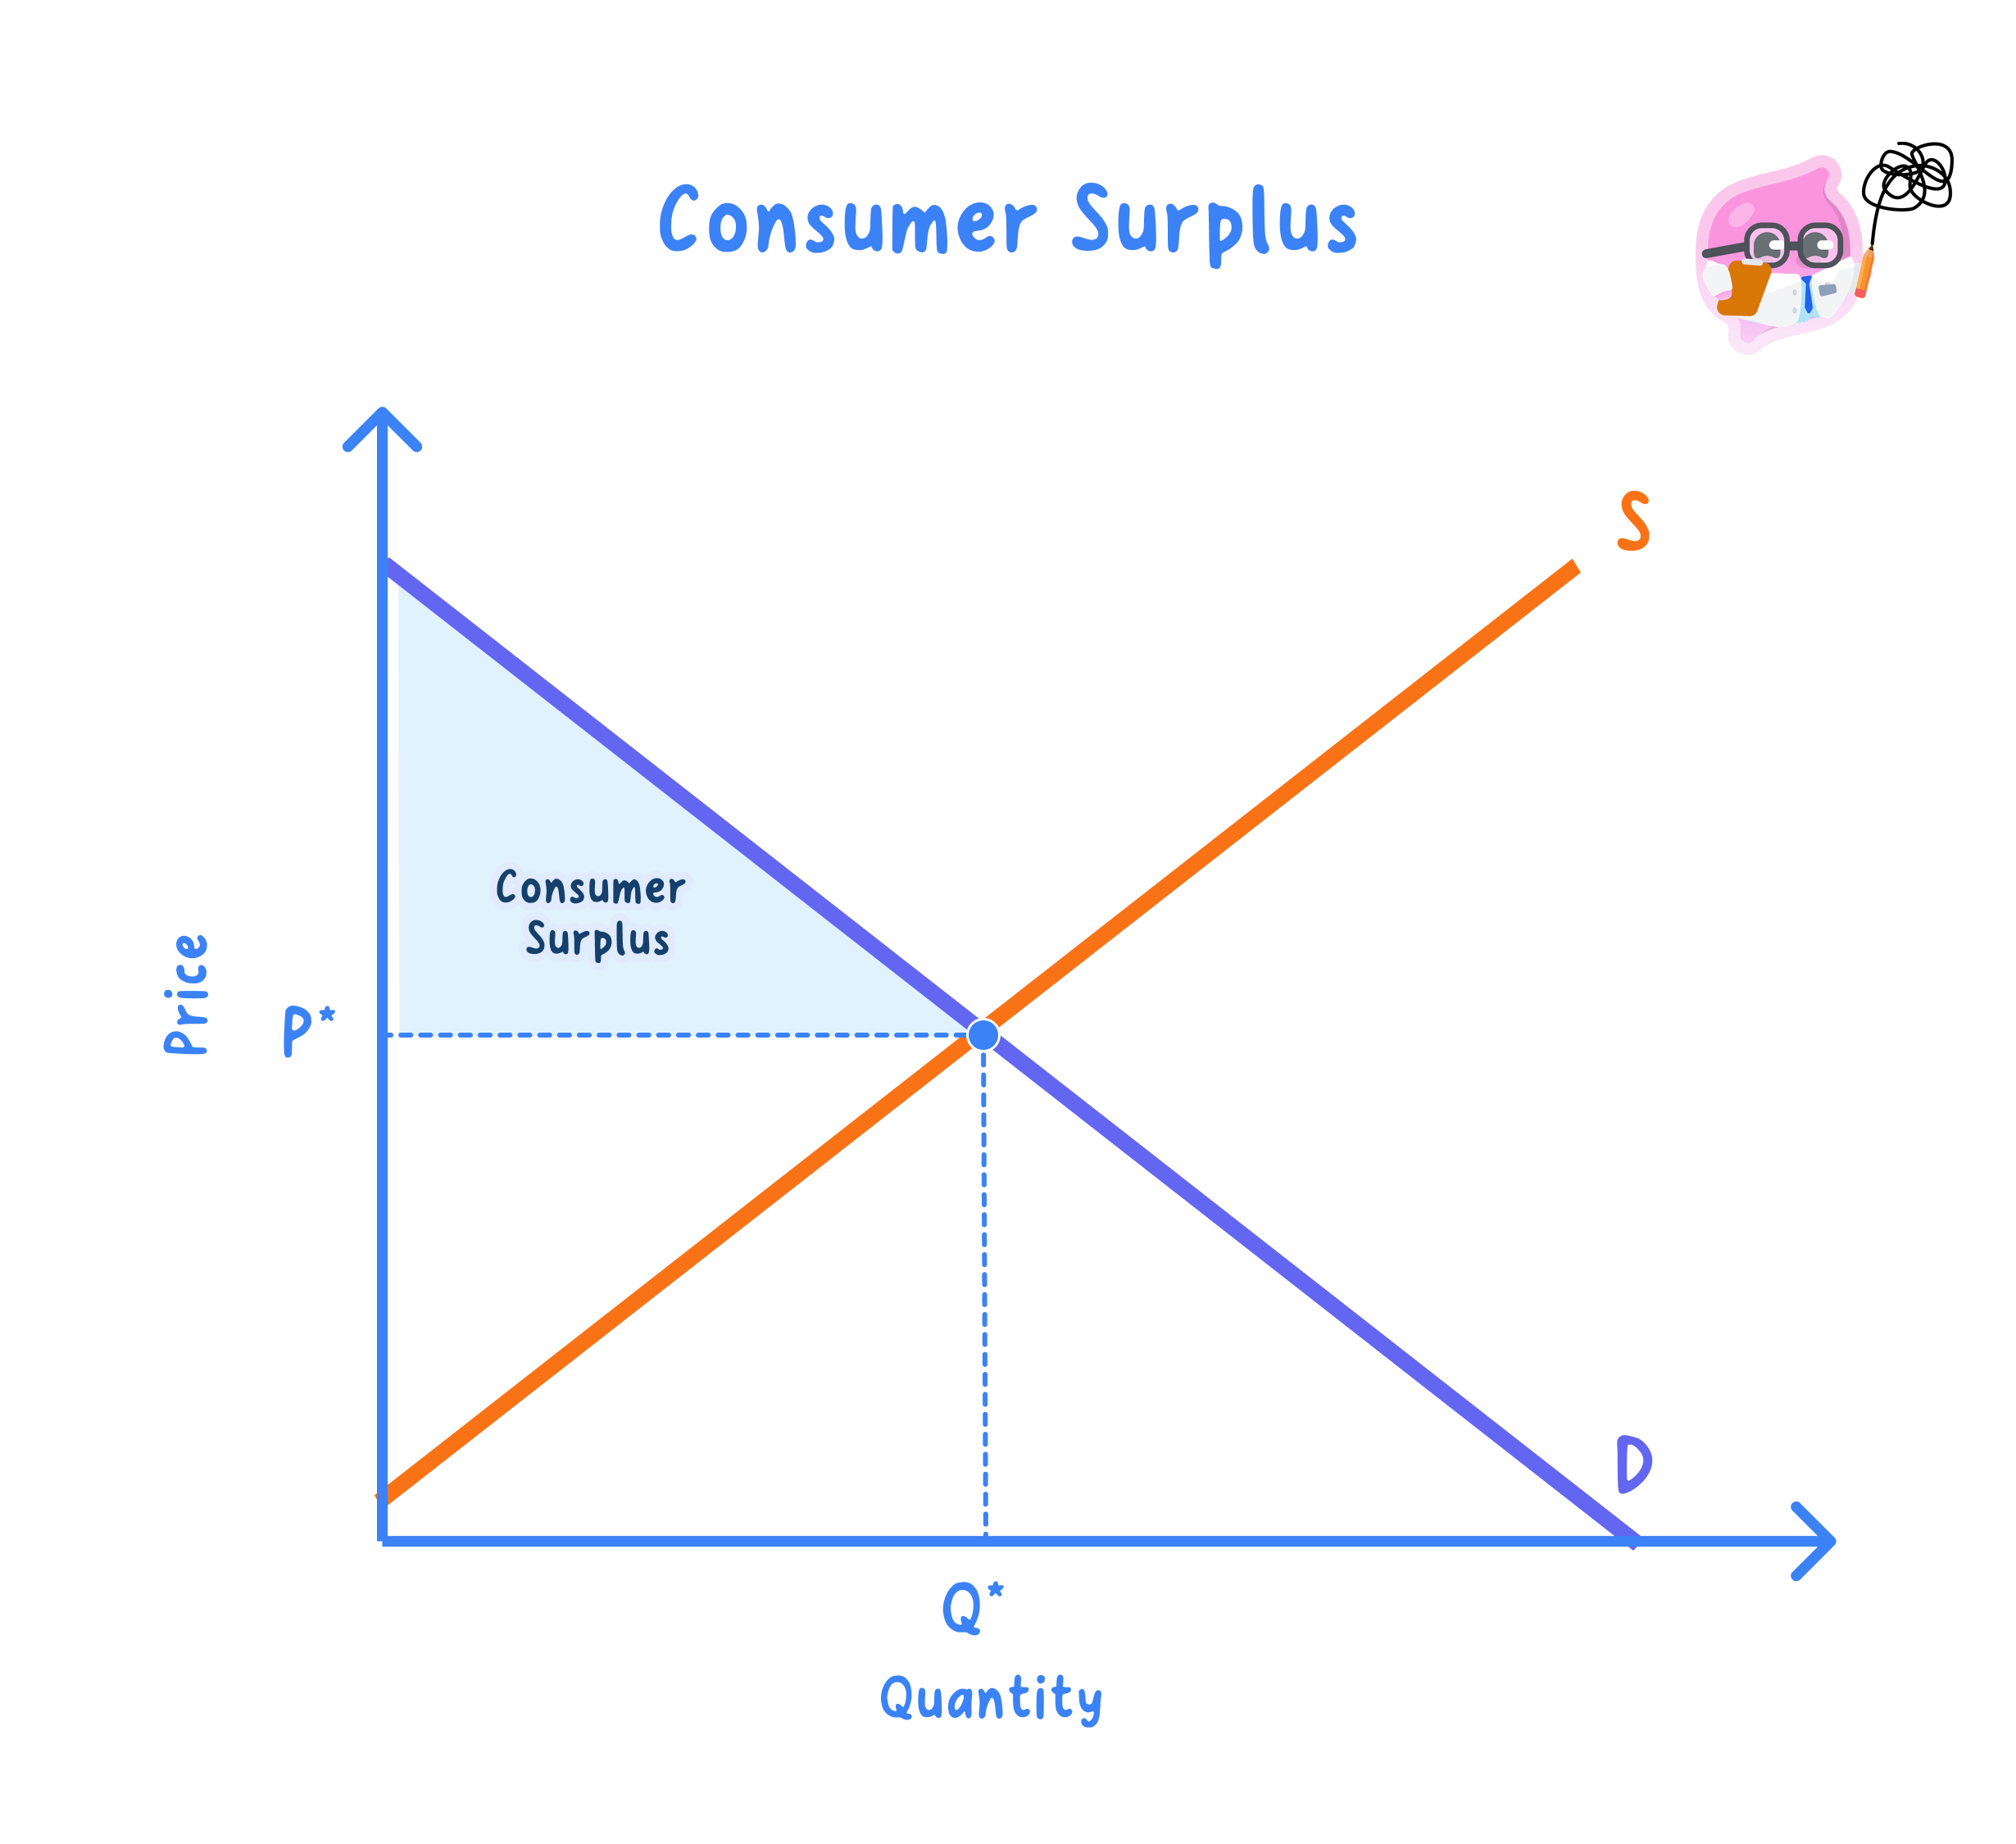 Consumer surplus is the difference between the maximum price consumers are willing to pay and the price they actually pay. The demand curve shows consumers' willingness to pay for successive units.
1.2.8 Consumer and producer surplus Lesson
Step-by-step lessons on Edexcel A A Level Economics 1.2.8 Consumer and producer surplus. Each one builds up to exam-style questions. Start with the core supply-and-demand models before moving on to the more evaluation-heavy macroeconomic policy topics.