

Practical chemistry is the heart of A-Level Chemistry. It is not just about what you do in the laboratory, but how you design investigations, manage risks, make precise measurements, and present data scientifically. These skills are assessed throughout your course via the Practical Endorsement (PAGs) and make up at least 15% of the marks in your written exam papers.
What you'll learn
- How to apply scientific methods to design valid, controlled chemistry investigations.
- How to distinguish between hazards and risks, and plan safety control measures.
- How to record qualitative and quantitative data with mathematical precision and consistency.
- How to research, reference, and correctly cite scientific sources.
1. Planning and Investigative Approaches
Every scientific discovery starts with an investigation. When you are tasked with solving a practical problem—such as determining the concentration of an unknown acid or investigating how temperature affects a reaction rate—you must take a systematic, structured approach.
Identifying the Variables
To design a valid experiment, you must clearly define your variables:
- Independent variable: The variable that you deliberately change or manipulate (e.g., temperature of a water bath, concentration of a reactant).
- Dependent variable: The variable that you measure to see how it responds to changes in the independent variable (e.g., the volume of gas produced per minute, the time taken for a precipitate to obscure a cross).
- Control variables: The variables that must be kept constant to ensure your test is fair and valid. If these are not controlled, they could affect your dependent variable and ruin the validity of your conclusions.
Designing a Control-Heavy Investigation
Always list your control variables with quantitative details in your experimental plans. For example, do not just write "keep concentration the same." Write: "Ensure the concentration of the hydrochloric acid remains constant at 1.0 mol dm−31.0\ \text{mol dm}^{-3}1.0 mol dm−3 for all runs."
2. Health and Safety: Hazards and Risks
Before you touch any glassware or chemicals, you must complete a risk assessment. This is a legal and practical requirement in every laboratory.
Hazard vs. Risk
Students frequently confuse these two distinct terms:
Hazard
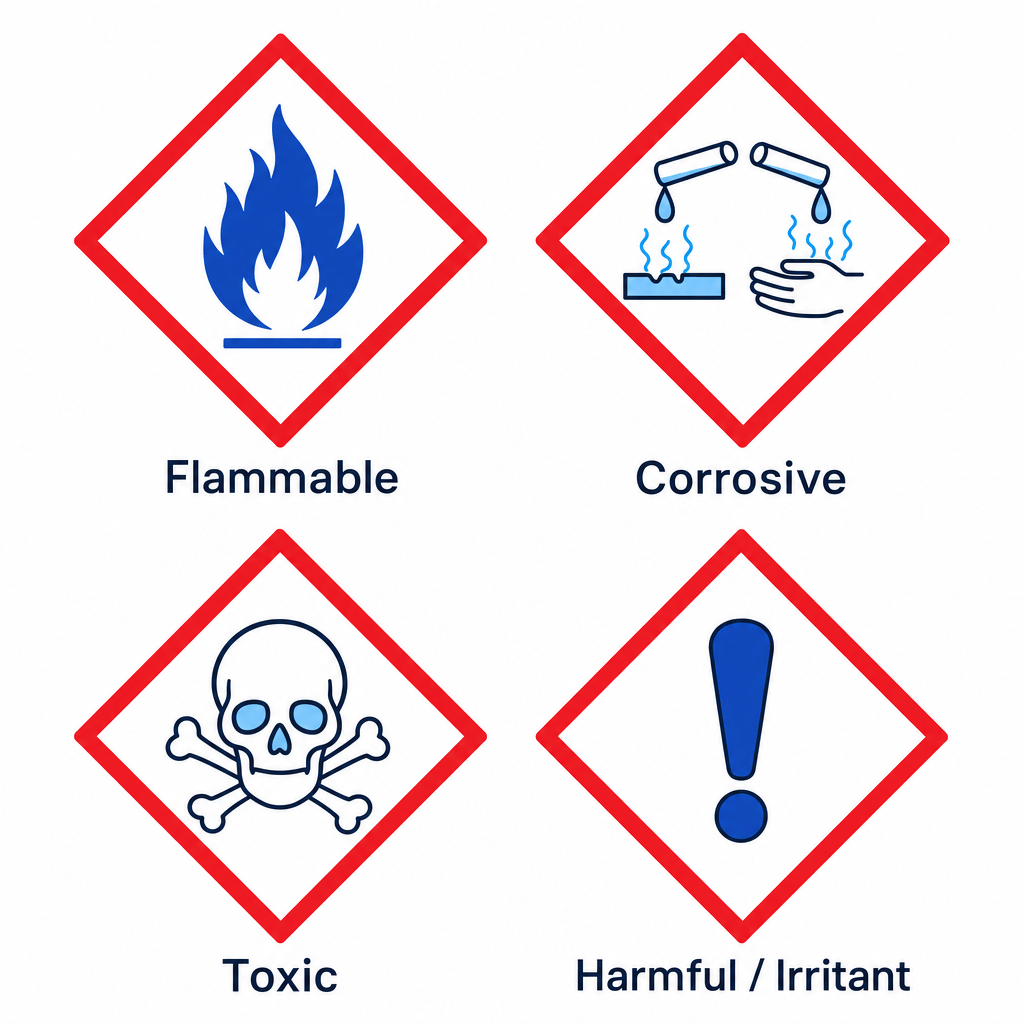
A hazard is an intrinsic property of a chemical substance or experimental procedure that has the potential to cause harm. Examples include toxicity, corrosiveness, flammability, and high pressures.
Risk
A risk is the likelihood or probability that a hazard will cause harm under the specific conditions of your experiment.
For instance, concentrated sulfuric acid is highly corrosive (hazard). If you are using a single drop of it in a sealed vial, the probability of it splashing into your eyes (risk) is low, but still present. If you are boiling 100 cm3100\ \text{cm}^3100 cm3 of it in an open beaker, the risk is extremely high.
Control Measures
To minimise risk, you must apply control measures. These are actions taken to reduce the probability of a hazard causing harm.
- Elimination / Substitution: Use a safer chemical if possible. For example, swap a toxic solvent like benzene for a less harmful one like cyclohexane.
- Engineering Controls: Use local exhaust ventilation, such as a fume cupboard, when dealing with toxic gases like chlorine (Cl2\text{Cl}_2Cl2) or nitrogen dioxide (NO2\text{NO}_2NO2).
- Personal Protective Equipment (PPE): Safety goggles (essential for all practicals to protect from splashes), lab coats (to protect skin and clothing from corrosive materials), and gloves (specifically chosen to resist the chemical you are using).
Vague safety precautions
In written exams, writing "wear goggles" is often not enough to gain marks if the question asks for a specific safety measure for a gas-producing or toxic reaction. You must link the precaution to the specific hazard: e.g., "Carry out the reaction in a fume cupboard because toxic sulphur dioxide gas is released."
3. Recording Observations and Measurements
Recording what you actually see and measure is a vital scientific skill. Your laboratory notebook is a legal record of your work and must be written clearly.
Qualitative Observations
Qualitative data describes the properties or characteristics of a change without using numbers. Be highly specific:
- Colour changes: Always state the starting colour of the solution and the final colour. Write "the yellow solution turned green", rather than "it changed colour".
- Precipitates: State the colour of the solid and the fact that a solid formed. Write "a dense white precipitate formed", rather than "it turned white".
- Gases: Record "vigorous effervescence" (fizzing) rather than "bubbles".
Quantitative Measurements
Quantitative data involves numbers and units. Every measurement you take has an inherent uncertainty associated with the equipment.
- Burettes: Always record burette readings to 2 decimal places (d.p.). The second decimal place must always end in a
0or a5(e.g., 24.30 cm324.30\ \text{cm}^324.30 cm3 or 24.35 cm324.35\ \text{cm}^324.35 cm3), as you can estimate to the nearest half of a division (which is 0.05 cm30.05\ \text{cm}^30.05 cm3). Even if the meniscus sits exactly on the 21 cm321\ \text{cm}^321 cm3 line, you must record it as 21.00 cm321.00\ \text{cm}^321.00 cm3. - Balances: Record all decimal places displayed on the balance (e.g., 4.321 g4.321\ \text{g}4.321 g on a 3 d.p. analytical balance).
- Thermometers: Usually recorded to the nearest 0.5 ∘C0.5\ ^\circ\text{C}0.5 ∘C or 0.1 ∘C0.1\ ^\circ\text{C}0.1 ∘C depending on the graduation.
Presenting Data in Tables
When drawing a table to record your data, follow these strict rules:
- Draw complete, ruled borders around your table.
- Put the independent variable in the first column and the dependent variable in subsequent columns.
- Every column header must state the quantity and the unit, separated by a solidus (slash
/), e.g., Time / s\text{Time}\ /\ \text{s}Time / s or Temperature / ∘C\text{Temperature}\ /\ ^\circ\text{C}Temperature / ∘C. - Do not write units inside the individual data cells—only write pure numbers.
The Solidus Rule
Always use the solidus in headers. For example, write Volume / cm3\text{Volume}\ /\ \text{cm}^3Volume / cm3. Avoid putting units in brackets like "Volume (cm3)(\text{cm}^3)(cm3)" because the forward slash is the preferred international scientific standard for separating a variable from its unit.
4. Processing and Presenting Data
Once you have recorded your raw data, you will need to process it. This typically involves calculations and graphing.
Significant Figures in Calculations
Your processed results can never be more precise than your roughest measurement.
- When multiplying or dividing data, quote your final answer to the same number of significant figures as the measurement with the fewest significant figures.
- When adding or subtracting data, quote your final answer to the same number of decimal places as the measurement with the fewest decimal places.
Graph Plotting
When plotting graphs:
- Axes: Plot the independent variable on the x-axis and the dependent variable on the y-axis. Label both axes clearly with their names and units separated by a slash (e.g., 1/T / K−11/T\ /\ \text{K}^{-1}1/T / K−1).
- Scale: Choose a scale where the data points occupy at least half of the graph paper grid in both horizontal and vertical directions.
- Plotting points: Use a sharp pencil to draw small, neat crosses (×\times× or +++).
- Line of best fit: Draw a single, smooth line or curve of best fit. It should balance the points evenly on either side. Do not blindly force the line through the origin unless you have physical justification.
- Anomalies: If a point is clearly an outlier due to an experimental error, circle it, label it as an anomaly, and exclude it when drawing your line of best fit.
Processing raw titration data and calculating the mean titre
A student carried out a acid-base titration to find the concentration of a sodium hydroxide solution. They obtained the following raw data:
| Titration | Trial | 1 | 2 | 3 |
|---|---|---|---|---|
| Final burette reading / cm3\text{cm}^3cm3 | 25.40 | 48.65 | 24.15 | 48.10 |
| Initial burette reading / cm3\text{cm}^3cm3 | 0.00 | 24.50 | 0.20 | 24.15 |
Process this raw data to determine the correct mean titre to use in subsequent concentration calculations.
- Calculate the raw titre for each titration run. Subtract the initial reading from the final reading for each column. Make sure all answers maintain 2 decimal places.
- Trial=25.40−0.00=25.40 cm3\text{Trial} = 25.40 - 0.00 = 25.40\ \text{cm}^3Trial=25.40−0.00=25.40 cm3
- Titration 1=48.65−24.50=24.15 cm3\text{Titration 1} = 48.65 - 24.50 = 24.15\ \text{cm}^3Titration 1=48.65−24.50=24.15 cm3
- Titration 2=24.15−0.20=23.95 cm3\text{Titration 2} = 24.15 - 0.20 = 23.95\ \text{cm}^3Titration 2=24.15−0.20=23.95 cm3
- Titration 3=48.10−24.15=23.95 cm3\text{Titration 3} = 48.10 - 24.15 = 23.95\ \text{cm}^3Titration 3=48.10−24.15=23.95 cm3
- Identify concordant titres. Concordant titres are those within ±0.10 cm3\pm 0.10\ \text{cm}^3±0.10 cm3 of each other. Analyze our calculated values:
- Titration 1 (24.15 cm324.15\ \text{cm}^324.15 cm3) and Titration 2 (23.95 cm323.95\ \text{cm}^323.95 cm3) differ by 0.20 cm30.20\ \text{cm}^30.20 cm3 (not concordant).
- Titration 2 (23.95 cm323.95\ \text{cm}^323.95 cm3) and Titration 3 (23.95 cm323.95\ \text{cm}^323.95 cm3) differ by 0.00 cm30.00\ \text{cm}^30.00 cm3 (concordant). The trial titre (25.40 cm325.40\ \text{cm}^325.40 cm3) must always be excluded from concordant calculations as it is a rough estimate.
- Calculate the mean of the concordant titres. Only use the values from Titration 2 and Titration 3.
Quote the mean to 2 decimal places to maintain consistency with the precision of your measuring instrument.
5. Research, Referencing, and Citations
As an A-Level chemist, you must be able to research scientific literature, gather secondary data (such as standard enthalpy changes or chemical safety information), and reference your sources properly.
How to Cite Sources
Plagiarism is the practice of taking someone else's work or ideas and passing them off as one's own. To avoid this, use a clear referencing system such as the Harvard system:
- In-text citation: Put the author's surname and year of publication in brackets within your text.
"The standard enthalpy of neutralisation for a strong acid and strong base is approximately −57.9 kJ mol−1-57.9\ \text{kJ mol}^{-1}−57.9 kJ mol−1 (Clayden, 2012)."
- Full bibliography citation: At the end of your report, provide the full details of the source:
Clayden, J., Greeves, N. and Warren, S. (2012). Organic Chemistry. 2nd ed. Oxford: Oxford University Press, p. 345.
For websites or online chemical databases:
Royal Society of Chemistry (2024). ChemSpider: Ethanol. [online] Available at: http://www.chemspider.com/Chemical-Structure.682.html [Accessed 14 Oct. 2024].
Do not cite search engines
Never write "Google" or "Wikipedia" as your source in your bibliography. Google is a search engine, not a source. Wikipedia is an open-source encyclopedia. Instead, find the original paper or textbook cited at the bottom of the Wikipedia page and reference that, or use trusted chemical databases like PubChem or the Royal Society of Chemistry.
In the exam
- Burette reading checks: If an exam question provides a table of titration results, check that all readings are written to exactly 2 decimal places (ending in
.00or.05). If they are not, you must correct them or point this out if asked to identify errors. - Mean titre selection: When calculating a mean titre, look closely at the data. Identify which titres are within 0.10 cm30.10\ \text{cm}^30.10 cm3 of each other. Average only those concordant titres, and never include the initial rough trial.
- Hazard vs Risk answers: If asked to suggest a safety precaution for an experiment, write down the hazard of the chemical (e.g., "chlorine gas is toxic") and the corresponding control measure (e.g., "so carry out the experiment inside a fume cupboard").
- Significant figures: Always look at the raw data given in the question. If the mass is given as 2.34 g2.34\ \text{g}2.34 g (3 s.f.) and the volume as 25.0 cm325.0\ \text{cm}^325.0 cm3 (3 s.f.), make sure your final calculated concentration is rounded to 3 significant figures.
Check yourself
- Why must a burette reading of exactly twenty-four cubic centimetres be recorded in your table as 24.00 cm324.00\ \text{cm}^324.00 cm3 instead of 24 cm324\ \text{cm}^324 cm3 or 24.0 cm324.0\ \text{cm}^324.0 cm3?
- A student plans to react copper carbonate with sulfuric acid. The acid is irritant. What is the hazard in this scenario, what is the risk, and how can the risk be minimised?
- Write a correct bibliography reference for your current A-Level Chemistry textbook using the Harvard referencing style.
