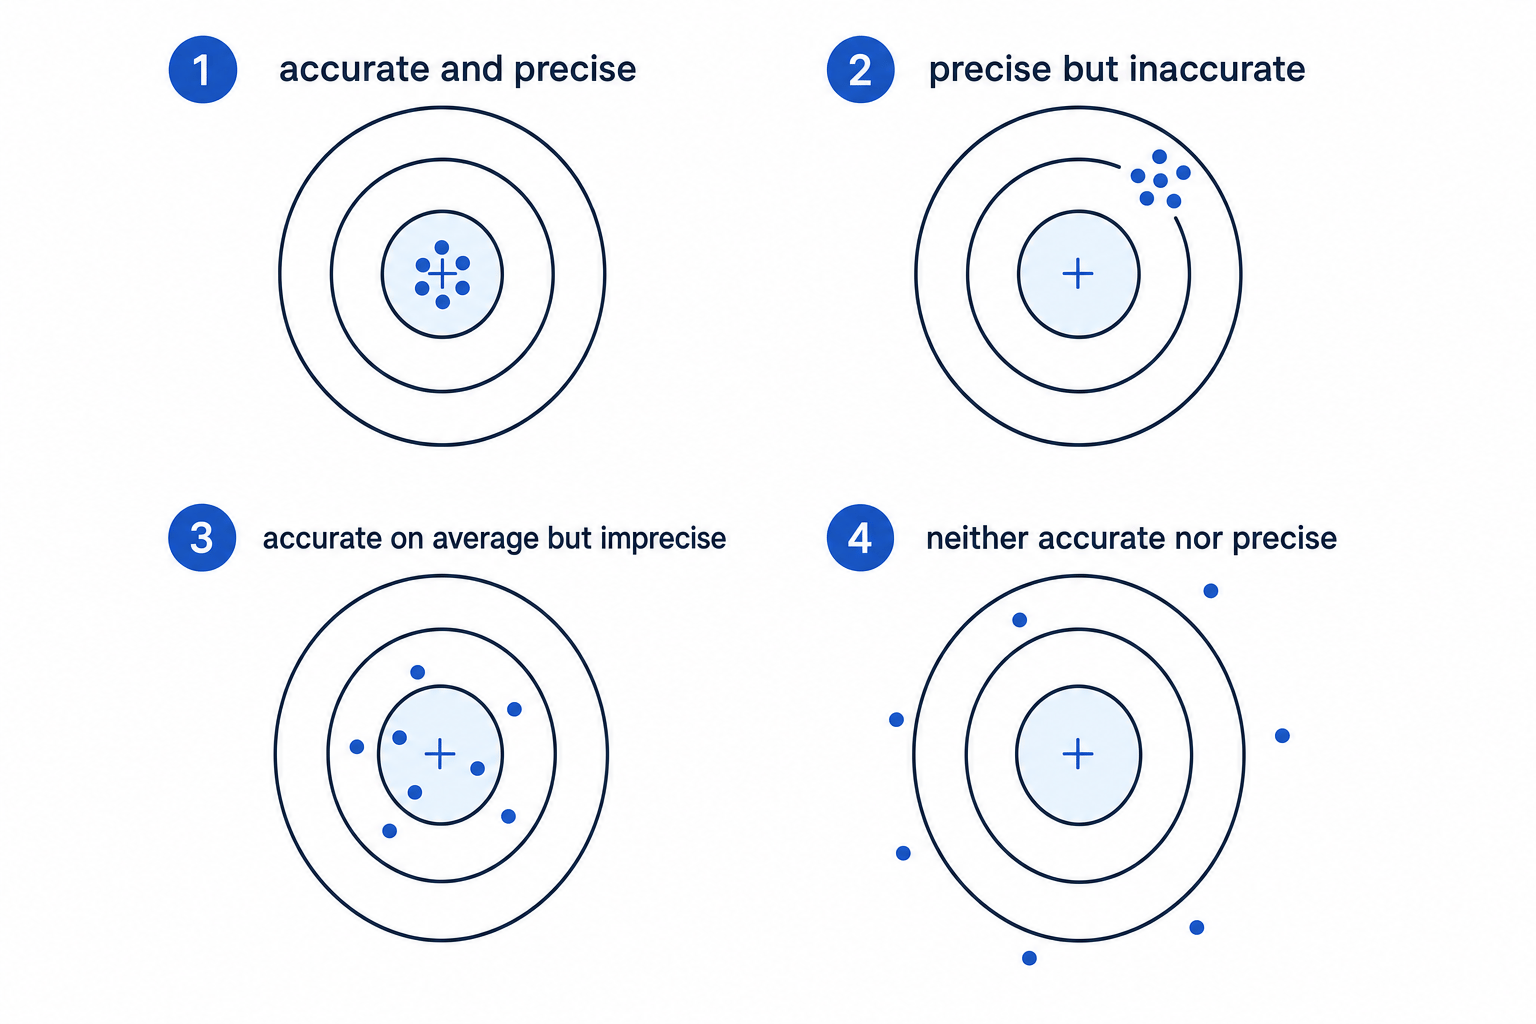
What you'll learn
- How to turn experimental results into justified conclusions.
- How to recognise anomalies and decide whether to include them.
- How accuracy, precision, percentage error and apparatus uncertainty differ.
- How to suggest improvements that actually address weaknesses in a method.
What “evaluation” means in practical chemistry
In A-Level Chemistry, evaluation means judging the quality of an experiment and its results. You are not just saying what happened; you are deciding how much confidence you should have in the data and what could be improved.
A strong evaluation normally links together:
- the results you obtained
- the conclusion you can support
- any uncertainties, anomalies or limitations
- realistic improvements to the procedure or apparatus
Evaluation
Evaluation is the process of judging how reliable, valid and accurate experimental results are, then using that judgement to draw conclusions and suggest improvements.
Drawing conclusions from results
A conclusion is a statement that answers the original aim or hypothesis using the evidence from the experiment.
A good conclusion should be:
- specific — it refers to the variable or quantity being investigated
- evidence-based — it quotes data, trends or calculated values
- limited appropriately — it does not claim more than the results support
For example, if rate increases when concentration increases, you can conclude that concentration affects rate. You should not automatically claim a particular rate equation unless the data justify it.
Evidence before opinion
In evaluation questions, avoid vague statements like “the experiment worked well”. Instead, say what the data show and whether the uncertainty is small enough to support the conclusion.
Drawing a justified conclusion
A student investigates the effect of hydrochloric acid concentration on the rate of reaction with magnesium. The initial rates are:
0.50 mol dm⁻³: 0.021 mol dm⁻³ s⁻¹
1.00 mol dm⁻³: 0.040 mol dm⁻³ s⁻¹
1.50 mol dm⁻³: 0.061 mol dm⁻³ s⁻¹
2.00 mol dm⁻³: 0.079 mol dm⁻³ s⁻¹
-
Compare how the rate changes when concentration doubles: from 0.50 to 1.00 mol dm⁻³, the rate changes from 0.021 to 0.040 mol dm⁻³ s⁻¹, which is close to doubling.
-
Check whether the overall pattern is consistent: as concentration increases by equal amounts, the rate increases by roughly equal amounts, so the results show an approximately proportional relationship.
-
Draw a careful conclusion: increasing the concentration of hydrochloric acid increases the rate of reaction, and the data suggest the rate is approximately directly proportional to acid concentration over this range.
-
Avoid overclaiming: these results alone do not prove the reaction mechanism, and the conclusion assumes temperature, magnesium surface area and volume were controlled.
Anomalies in experimental measurements
An anomaly is a result that does not fit the pattern shown by the rest of the data. It may be caused by a mistake, contamination, poor technique, an instrument fault, or an uncontrolled variable.
Anomaly
An anomalous result is a measurement that is clearly inconsistent with the rest of the data or with a reliable trend.
You should not reject a result just because you dislike it. In written answers, justify why it is anomalous by comparing it with repeat measurements or the trend on a graph.
For titrations, an anomalous titre might be much higher or lower than the concordant titres. For a graph, an anomaly may be a point far from the line of best fit.
Identifying an anomalous titre
A titration gives these titres: 24.75 cm³, 24.80 cm³, 24.78 cm³ and 25.60 cm³. Calculate the mean titre to use.
-
Compare the spread of the repeat titres. The first three results are close together because 24.80−24.75=0.05 cm324.80 - 24.75 = 0.05\ \text{cm}^324.80−24.75=0.05 cm3.
-
Compare the fourth titre with the cluster. The value 25.60 cm³ is about 0.8 cm³ higher than the others, so it does not fit the repeated pattern.
-
Exclude the anomalous value with a reason. Use only 24.75 cm³, 24.80 cm³ and 24.78 cm³ because they are concordant.
-
Calculate the mean:
Vmean=24.75+24.80+24.783=24.776... cm3V_{\text{mean}} = \frac{24.75 + 24.80 + 24.78}{3} = 24.776...\ \text{cm}^3Vmean=324.75+24.80+24.78=24.776... cm3 -
Quote the mean suitably: the mean titre is 24.78 cm³.
Deleting data without justification
Do not simply say “ignore the anomalous result”. Explain why it is anomalous, for example because it is not concordant with the repeated titres or lies far from the line of best fit.
Limitations in experimental procedures
A limitation is a weakness in the method that affects the quality of the results. Limitations can affect accuracy, precision, or validity.
Validity
A valid experiment tests what it is intended to test. Variables other than the independent variable must be controlled so that the conclusion is meaningful.
Common limitations in chemistry practicals include:
- heat loss to the surroundings in enthalpy experiments
- subjective colour judgement at a titration end-point
- gas escaping before a bung is fitted
- measuring small volumes with apparatus that has a large uncertainty
- incomplete transfer of solid or solution
- impurities in reagents
- not controlling temperature in rates or equilibrium experiments
- using a measuring cylinder when a pipette or burette would be more suitable
When describing a limitation, be precise. “Human error” is usually too vague. Say exactly what might have happened and how it affects the result.
Say the direction if you can
A strong evaluation often says whether the limitation makes the calculated value too high or too low. For example, heat loss in a calorimetry experiment usually makes the measured temperature change smaller, so the calculated enthalpy change has a smaller magnitude.
Accuracy and precision
Accuracy and precision are not the same thing.
Accuracy
Accuracy is how close a measured value is to the true or accepted value.
Precision
Precision is how close repeat measurements are to each other.
A set of results can be precise but not accurate. For example, a miscalibrated balance might give very similar readings every time, but all readings are shifted away from the true value.
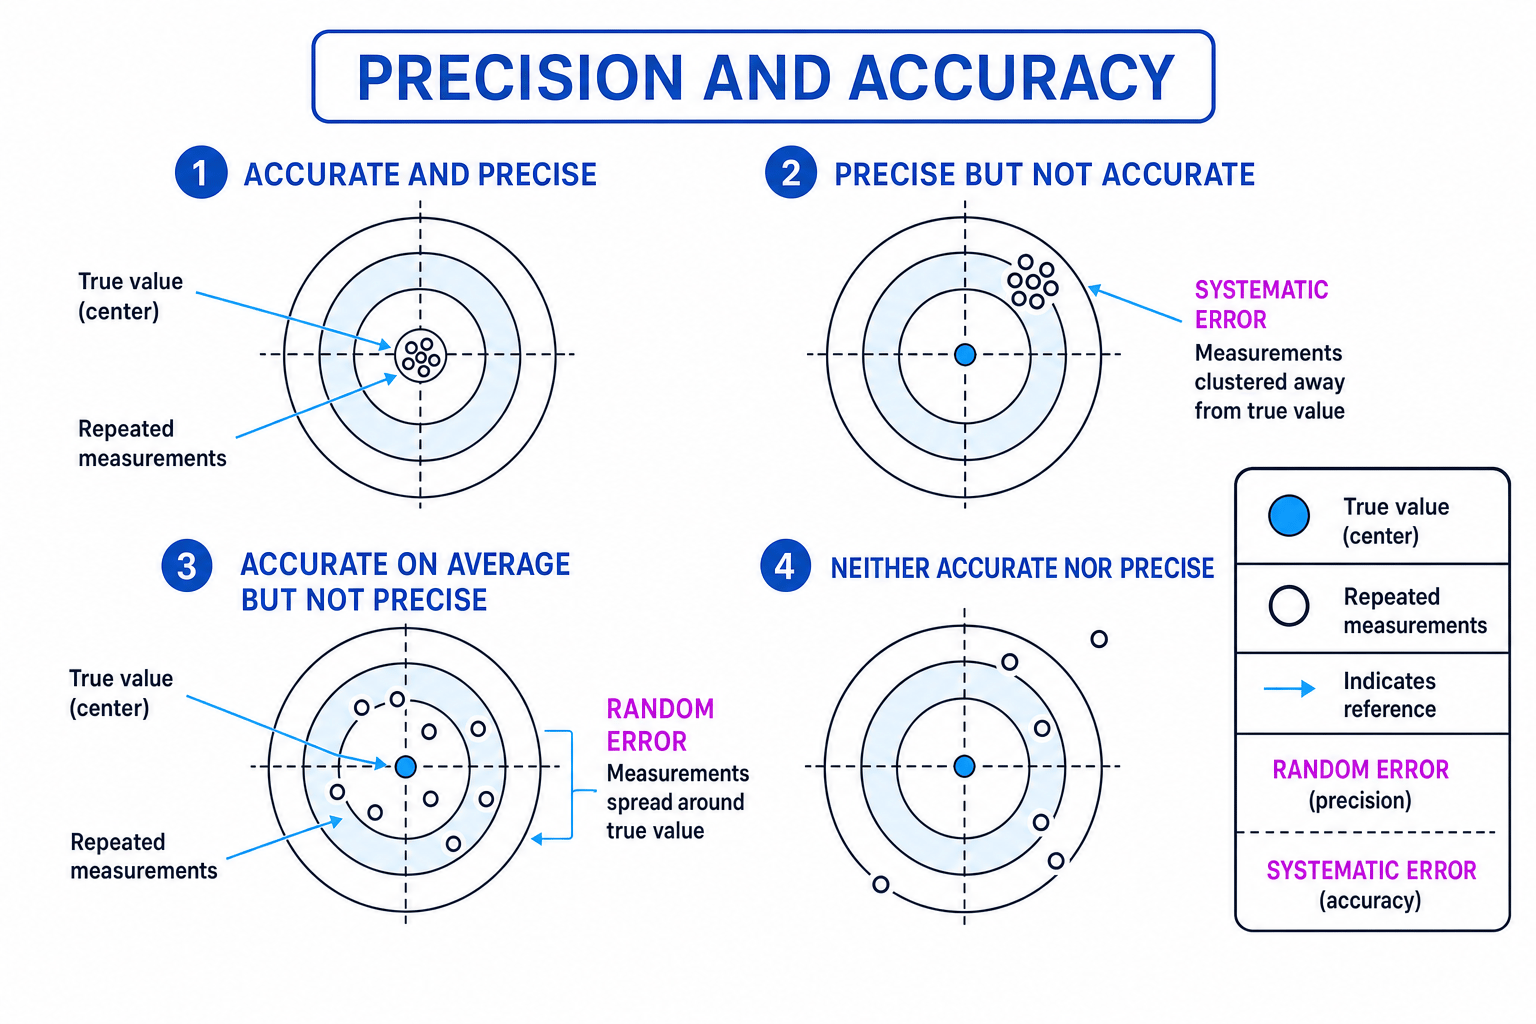
Two important types of error explain this:
- Random errors cause scatter in repeat results. They reduce precision.
- Systematic errors shift results consistently in one direction. They reduce accuracy.
Repeats do not fix everything
Repeating and averaging can reduce the effect of random error, but it will not remove a systematic error such as a wrongly calibrated instrument.
Margins of error and apparatus uncertainty
An uncertainty tells you the range within which the true value is expected to lie. It is usually written with a ± sign.
For example, a titre might be written as:
24.80±0.10 cm324.80 \pm 0.10\ \text{cm}^324.80±0.10 cm3This means the likely range is 24.70 cm³ to 24.90 cm³.
Margin of error
A margin of error is the ± range around a measured or calculated value, caused by uncertainty in measurement.
Choosing apparatus uncertainty
Use the uncertainty given in the question if one is stated. If not, common assumptions are:
- for an analogue scale, uncertainty is often half the smallest division
- for a burette titre, add the uncertainty in the initial and final readings
- for a temperature change, add the uncertainty in the initial and final temperature readings
So if each burette reading has uncertainty ±0.05 cm³, the titre has uncertainty:
±0.05 cm3+±0.05 cm3=±0.10 cm3\pm 0.05\ \text{cm}^3 + \pm 0.05\ \text{cm}^3 = \pm 0.10\ \text{cm}^3±0.05 cm3+±0.05 cm3=±0.10 cm3Percentage uncertainty
Percentage uncertainty compares the absolute uncertainty with the size of the measurement:
percentage uncertainty=absolute uncertaintymeasured value×100\text{percentage uncertainty} = \frac{\text{absolute uncertainty}}{\text{measured value}} \times 100percentage uncertainty=measured valueabsolute uncertainty×100For calculations involving multiplication or division, such as c=nVc = \frac{n}{V}c=Vn or q=mcΔTq = mc\Delta Tq=mcΔT, percentage uncertainties are usually added.
Combining apparatus uncertainties
A titration uses a 25.00 cm³ pipette with uncertainty ±0.06 cm³. The mean burette titre is 24.80 cm³. Each burette reading has uncertainty ±0.05 cm³. The calculated concentration is 0.0992 mol dm⁻³. Estimate the percentage uncertainty in the concentration.
-
Work out the burette titre uncertainty. A titre comes from two readings, so the absolute uncertainty is ±0.05+±0.05=±0.10 cm3\pm 0.05 + \pm 0.05 = \pm 0.10\ \text{cm}^3±0.05+±0.05=±0.10 cm3.
-
Calculate the percentage uncertainty in the titre:
0.1024.80×100=0.403%\frac{0.10}{24.80} \times 100 = 0.403\%24.800.10×100=0.403% -
Calculate the percentage uncertainty in the pipette volume:
0.0625.00×100=0.240%\frac{0.06}{25.00} \times 100 = 0.240\%25.000.06×100=0.240% -
The concentration depends on a ratio of volumes, so add the percentage uncertainties:
0.403%+0.240%=0.643%0.403\% + 0.240\% = 0.643\%0.403%+0.240%=0.643% -
Convert this into an absolute uncertainty in the concentration:
0.643100×0.0992=0.000638 mol dm−3\frac{0.643}{100} \times 0.0992 = 0.000638\ \text{mol dm}^{-3}1000.643×0.0992=0.000638 mol dm−3 -
Quote the result sensibly:
0.0992±0.0006 mol dm−30.0992 \pm 0.0006\ \text{mol dm}^{-3}0.0992±0.0006 mol dm−3
Forgetting two readings
A titre and a temperature change both involve two readings. Add the absolute uncertainties before calculating the percentage uncertainty.
Percentage error compared with an accepted value
Sometimes you compare your experimental value with a known or accepted value. This is usually called percentage error:
percentage error=∣experimental value−accepted value∣accepted value×100\text{percentage error} = \frac{|\text{experimental value} - \text{accepted value}|}{\text{accepted value}} \times 100percentage error=accepted value∣experimental value−accepted value∣×100The vertical bars mean “take the positive difference”. Percentage error is about closeness to a true value, so it is linked to accuracy.
Calculating percentage error
A student measures an enthalpy change as −54.0 kJ mol⁻¹. The accepted value is −57.3 kJ mol⁻¹. Calculate the percentage error.
-
Find the difference in magnitudes using the accepted value as the comparison: ∣−54.0−(−57.3)∣=3.3 kJ mol−1|-54.0 - (-57.3)| = 3.3\ \text{kJ mol}^{-1}∣−54.0−(−57.3)∣=3.3 kJ mol−1.
-
Divide by the accepted value: 3.357.3=0.0576\frac{3.3}{57.3} = 0.057657.33.3=0.0576.
-
Convert to a percentage: 0.0576×100=5.76%0.0576 \times 100 = 5.76\%0.0576×100=5.76%, so the percentage error is 5.8% to two significant figures.
Refining experimental design
To refine an experiment means to improve the method or apparatus so that the results become more accurate, precise or valid.
Strong improvements are targeted. They should name:
- the problem
- the change to the method or apparatus
- how the change improves the data
Weak improvement: “Use better equipment.”
Strong improvement: “Use a volumetric pipette instead of a measuring cylinder to measure 25.0 cm³, because the pipette has a smaller uncertainty and gives a more precise volume.”
Choosing the most useful improvement
A student measures an enthalpy change using 50.0 cm³ of solution and a thermometer. The temperature rise is only 3.2 °C. The thermometer uncertainty is ±0.5 °C per reading, and the volume uncertainty is ±0.5 cm³. Suggest the best refinement.
-
Estimate the uncertainty in the temperature change. Since the temperature change uses two readings, the absolute uncertainty is ±1.0 ∘C\pm 1.0\ ^\circ\text{C}±1.0 ∘C.
-
Calculate the percentage uncertainty in ΔT\Delta TΔT:
1.03.2×100=31.25%\frac{1.0}{3.2} \times 100 = 31.25\%3.21.0×100=31.25% -
Compare this with the volume uncertainty:
0.550.0×100=1.0%\frac{0.5}{50.0} \times 100 = 1.0\%50.00.5×100=1.0% -
Identify the main weakness. The temperature change has by far the larger percentage uncertainty, so improving temperature measurement would have the biggest effect.
-
Suggest targeted refinements: use a more precise temperature probe or data logger, use insulation and a lid to reduce heat loss, and use larger quantities if safe so that ΔT\Delta TΔT is larger.
Prioritise the biggest weakness
The best improvement is not always the most expensive apparatus. It is the change that tackles the largest uncertainty or the most serious systematic error.
Bringing evaluation together
In a written practical question, you may need to combine several ideas at once. A good answer might say:
- the conclusion is supported because repeat results are close together
- one result is anomalous because it is far from the trend
- the percentage uncertainty is large because the measured change is small
- the method is limited by heat loss, gas loss, subjective colour change or poor control variables
- a specific apparatus change would reduce that limitation
Do not confuse reliability with accuracy
Reliable results are repeatable, but repeatable results can still be inaccurate if there is a systematic error.
In the exam
-
Base your conclusion on the data: quote a trend, mean, calculated value or comparison with an accepted value.
-
For anomalies, justify your decision using repeats, concordance or distance from a line of best fit.
-
For uncertainty calculations, use absolute uncertainties for additions/subtractions and percentage uncertainties for multiplications/divisions.
-
For improvements, name the exact limitation and explain how the change reduces it.
-
Avoid vague phrases such as “human error”, “more accurate equipment” or “repeat it” unless you explain the specific effect.
Check yourself
- What is the difference between accuracy and precision?
- Why does a burette titre usually have twice the uncertainty of a single burette reading?
- How would you decide whether a result is genuinely anomalous?