

In A-Level Chemistry, the practical endorsement (PAGs) is not the only place where your laboratory skills are assessed. A significant proportion of the marks in your written exam papers will test your ability to process, analyze, and evaluate experimental data.
Whether you are calculating a reaction rate, processing titration volumes, or plotting a graph to find an activation energy, you must be precise and methodical.
What you'll learn
- How to process and interpret qualitative and quantitative experimental results.
- How to apply the strict rules of significant figures to multi-step calculations.
- How to plot, label, and extract key values (gradients and intercepts) from experimental graphs.
1. Processing and Interpreting Results
To analyze data effectively, you must first understand the distinction between the two primary classes of experimental observations.
Qualitative vs. Quantitative Data
- Qualitative data: Non-numerical, descriptive observations such as colour changes, gas evolution (effervescence), or the formation of a precipitate (e.g., "the solution turned from orange to green").
- Quantitative data: Numerical measurements recorded using an instrument, which always contain a value and a unit (e.g., "25.00 cm325.00\text{ cm}^325.00 cm3" or "0.45 g0.45\text{ g}0.45 g").
When interpreting qualitative observations, your conclusions must link directly to established chemical tests. For instance, if adding aqueous silver nitrate to an unknown halide solution yields a cream precipitate that dissolves in concentrated but not dilute ammonia, your valid conclusion must identify the presence of bromide ions (Br−\text{Br}^-Br−).
When processing quantitative data, you are often looking to find an underlying chemical relationship, such as determining the stoichiometry of a reaction or calculating an enthalpy change.
2. Mathematical Skills and Significant Figures
A common source of lost marks in calculations is the incorrect use of significant figures (often abbreviated as SF). In chemistry, the precision of your final calculated value must reflect the precision of the experimental measurements used to obtain it.
Rules for Significant Figures in Calculations
The Least Precise Rule
When multiplying or dividing quantitative values, your final answer must be rounded to the same number of significant figures as the measurement with the fewest significant figures used in the calculation.
To apply this correctly, keep these rules in mind:
- Intermediate rounding: Never round your numbers mid-calculation, as this introduces rounding errors. Keep the full value in your calculator memory and round only the final answer.
- Adding or subtracting: When adding or subtracting, match your answer to the fewest decimal places (not significant figures) among your starting values.
- Constants and molar masses: Use the relative atomic masses (ArA_rAr) provided on your OCR periodic table to 1 decimal place (e.g., O=16.0\text{O} = 16.0O=16.0, Cl=35.5\text{Cl} = 35.5Cl=35.5). These should be factored into your determination of the overall precision.
Ignoring Zeros
Trailing zeros after a decimal point are significant. For example, 25.0 cm325.0\text{ cm}^325.0 cm3 has 3 significant figures, whereas 25 cm325\text{ cm}^325 cm3 has only 2. Writing 252525 instead of 25.025.025.0 in a titration calculation can cost you marks for precision.
Determining significant figures in a concentration calculation
A student dissolves 0.450 g0.450\text{ g}0.450 g of pure sodium hydroxide (NaOH\text{NaOH}NaOH) in distilled water to prepare a volumetric solution of exactly 250.0 cm3250.0\text{ cm}^3250.0 cm3. Calculate the concentration of the resulting solution in mol dm−3\text{mol dm}^{-3}mol dm−3 to the correct number of significant figures.
- Calculate the molar mass (MMM) of NaOH\text{NaOH}NaOH: Using the OCR periodic table, find the relative atomic masses: Na=23.0\text{Na} = 23.0Na=23.0, O=16.0\text{O} = 16.0O=16.0, H=1.0\text{H} = 1.0H=1.0.
(This value has 3 significant figures).
- Calculate the amount of NaOH\text{NaOH}NaOH in moles (nnn):
(Keep this unrounded value in your calculator).
- Convert the volume (VVV) to dm3\text{dm}^3dm3:
(The volume 250.0 cm3250.0\text{ cm}^3250.0 cm3 has 4 significant figures).
- Calculate the concentration (ccc):
-
Determine the correct significant figures:
- Mass =0.450 g= 0.450\text{ g}=0.450 g (3 SF)
- Molar mass =40.0 g mol−1= 40.0\text{ g mol}^{-1}=40.0 g mol−1 (3 SF)
- Volume =250.0 cm3= 250.0\text{ cm}^3=250.0 cm3 (4 SF)
The lowest number of significant figures in the starting data is 3. Therefore, the final concentration must be quoted to 3 significant figures:
3. Graph Plotting and Interpretation
Graphs are powerful tools for identifying trends, confirming mathematical relationships, and determining rates of reaction.
Key Rules for Plotting Graphs in Exams
- Axis Selection: Always plot the independent variable (the one you change, e.g., time or temperature) on the horizontal x-axis, and the dependent variable (the one you measure, e.g., volume of gas or absorbance) on the vertical y-axis.
- Labelling: Each axis must be labelled with the quantity and its standard unit, separated by a solidus (forward slash), such as:
- Scales: Use a sensible scale where the plotted data points occupy at least half of both the vertical and horizontal grid space. Avoid "awkward" scales like 3 or 7 grid squares per unit; stick to multiples of 1, 2, 5, or 10.
- Line of Best Fit: Draw a single, smooth, thin line or curve that represents the overall trend. It should not simply connect the dots (no "dot-to-dot" lines). Anomalous points (outliers) should be identified and ignored when drawing the line of best fit.
Calculating Gradients and Intercepts
The gradient (mmm) of a straight-line graph represents the rate of change of yyy with respect to xxx:
m=ΔyΔx=y2−y1x2−x1 m = \frac{\Delta y}{\Delta x} = \frac{y_2 - y_1}{x_2 - x_1} m=ΔxΔy=x2−x1y2−y1If the relationship is non-linear (a curve), you must draw a tangent to the curve at the specified point to calculate the gradient at that particular moment.
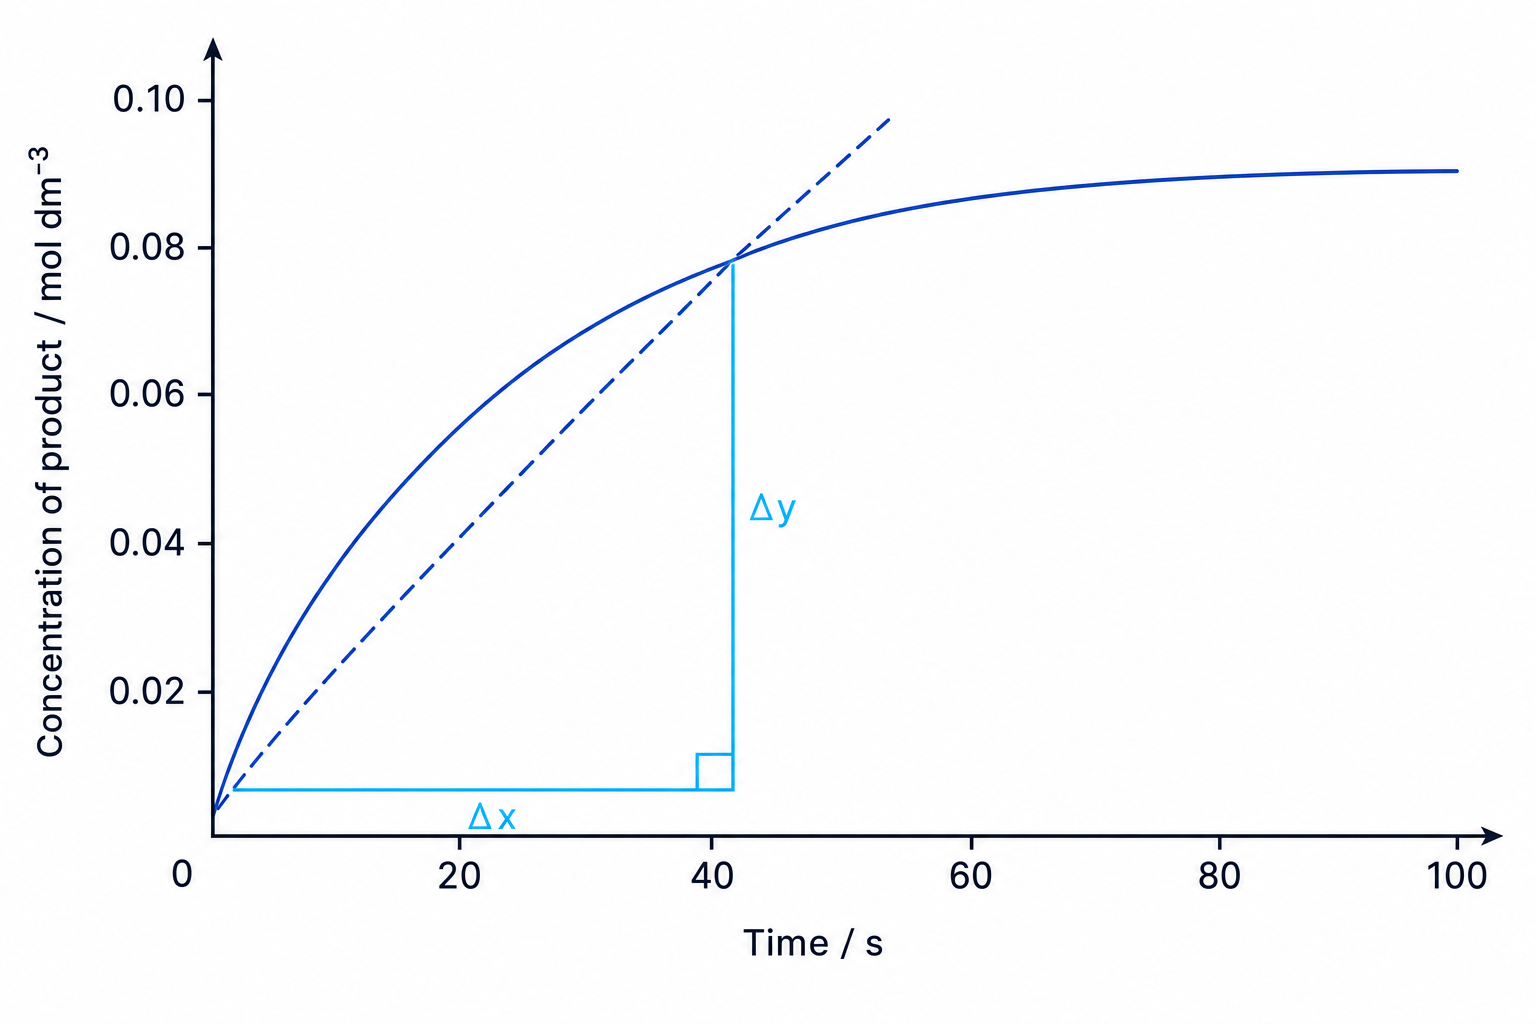
Drawing a Tangent
When placing your ruler to draw a tangent, ensure that the angle between the ruler and the curve is symmetrical on both sides of the point of contact. This minimizes geometric errors.
Calculating initial rate of reaction from a tangent
Using the curve plotted in the graph above, calculate the initial rate of reaction at t=0 st = 0\text{ s}t=0 s.
- Draw a tangent at the origin: A dashed line tangent to the curve is drawn starting exactly at (0,0)(0, 0)(0,0).
- Construct a large right-angled triangle: To maximize precision, choose two points on the tangent line that are far apart. Let's select the origin (0,0)(0, 0)(0,0) as (x1,y1)(x_1, y_1)(x1,y1) and a point further up the tangent line (40,0.080)(40, 0.080)(40,0.080) as (x2,y2)(x_2, y_2)(x2,y2).
- Calculate the change in yyy (Δy\Delta yΔy):
- Calculate the change in xxx (Δx\Delta xΔx):
- Compute the gradient:
The initial rate of reaction is therefore 2.0×10⁻³ mol dm−3 s−12.0 \times 10^{-3}\text{ mol dm}^{-3}\text{ s}^{-1}2.0×10⁻³ mol dm−3 s−1.
Gradient Units
Always work out the unit of your gradient by dividing the unit on the y-axis by the unit on the x-axis. For example, if the y-axis is in mol dm−3\text{mol dm}^{-3}mol dm−3 and the x-axis is in s\text{s}s, the unit of the gradient is:
mol dm−3s=mol dm−3 s−1 \frac{\text{mol dm}^{-3}}{\text{s}} = \text{mol dm}^{-3}\text{ s}^{-1} smol dm−3=mol dm−3 s−1Do not omit this unit in your final answer unless specified!
In the exam
- Always read the scale carefully: Before plotting or reading coordinates, determine the exact value of each small grid square. A single small square might represent 0.10.10.1, 0.20.20.2, or 0.050.050.05 units depending on the scale.
- Draw a large triangle for gradients: When calculating a gradient, make sure your construction triangle covers more than half the length of your drawn tangent or line of best fit. Small triangles lead to high percentage errors.
- Show your working on the graph: Draw your tangent and the construction triangle directly on the paper. The examiner looks for these lines when awarding method marks.
- Match your calculator rounding: If the values in the question are given to 3 significant figures, write your final answer to 3 significant figures. Never leave a long string of calculator decimals.
Check yourself
- Why is it incorrect to round intermediate numbers during a multi-step chemistry calculation?
- How do you determine the correct units for the gradient of a graph where the y-axis is "Volume / cm3\text{cm}^3cm3" and the x-axis is "Time / s\text{s}s"?
- If a piece of mass balance data is recorded as 1.020 g1.020\text{ g}1.020 g, how many significant figures does it possess?
