

What you'll learn
- How to write and use rate equations such as rate=k[A]m[B]n\text{rate} = k[A]^m[B]^nrate=k[A]m[B]n.
- How to deduce reaction orders from initial rates data and graphs.
- How half-life links to the rate constant for first-order reactions.
- How rate equations give evidence for mechanisms, and how temperature affects kkk.
1. Reaction rate: change per unit time
A reaction is “fast” if the amounts or concentrations of reactants/products change quickly.
Rate of reaction
The rate of reaction is the change in concentration of a reactant or product per unit time. For concentration in mol dm⁻³ and time in s, the usual unit is mol dm⁻³ s⁻¹.
For a product, the concentration increases, so the gradient is positive. For a reactant, the concentration decreases, so the gradient is negative; we take the rate as a positive value:
rate≈−Δ[reactant]Δt\text{rate} \approx -\frac{\Delta[\text{reactant}]}{\Delta t}rate≈−ΔtΔ[reactant]Reactant gradients
On a concentration–time graph for a reactant, rate = -gradient. The gradient itself is negative, but reaction rate is quoted as positive.
2. Orders, rate equations and the rate constant
For many reactions, experiment shows that the rate depends on reactant concentrations in a predictable way.
Rate equation terms
For rate=k[A]m[B]n\text{rate} = k[A]^m[B]^nrate=k[A]m[B]n:
- The order with respect to A is mmm.
- The order with respect to B is nnn.
- The overall order is m+nm + nm+n.
- The rate constant, kkk, is the constant of proportionality at a fixed temperature.
- In this topic, individual orders are usually 0, 1 or 2.
If a reactant is zero order, changing its concentration has no effect on rate, because [A]0=1[A]^0 = 1[A]0=1.
Orders are experimental
You normally cannot deduce orders from the balanced equation. Orders come from rate data, unless you are dealing with an elementary step in a proposed mechanism.
Deducing orders from initial rates
The initial rate is the rate right at the start of the reaction, before concentrations have changed much. To find an order, compare two experiments where only one reactant concentration changes.
Deducing orders from initial rates
Data for a reaction involving A and B:
- Experiment 1: [A]=0.100[A] = 0.100[A]=0.100 mol dm⁻³, [B]=0.100[B] = 0.100[B]=0.100 mol dm⁻³, rate = 2.40×10−42.40 \times 10^{-4}2.40×10⁻⁴ mol dm⁻³ s⁻¹
- Experiment 2: [A]=0.200[A] = 0.200[A]=0.200 mol dm⁻³, [B]=0.100[B] = 0.100[B]=0.100 mol dm⁻³, rate = 9.60×10−49.60 \times 10^{-4}9.60×10⁻⁴ mol dm⁻³ s⁻¹
- Experiment 3: [A]=0.100[A] = 0.100[A]=0.100 mol dm⁻³, [B]=0.200[B] = 0.200[B]=0.200 mol dm⁻³, rate = 2.40×10−42.40 \times 10^{-4}2.40×10⁻⁴ mol dm⁻³ s⁻¹
-
Compare experiments 1 and 2: [A][A][A] doubles while [B][B][B] is constant, and the rate increases by a factor of 4. So 2m=42^m = 42m=4, giving m=2m = 2m=2.
-
Compare experiments 1 and 3: [B][B][B] doubles while [A][A][A] is constant, and the rate is unchanged. So 2n=12^n = 12n=1, giving n=0n = 0n=0.
-
Write the rate equation: rate=k[A]2[B]0\text{rate} = k[A]^2[B]^0rate=k[A]2[B]0, so rate=k[A]2\text{rate} = k[A]^2rate=k[A]2. The overall order is 2.
-
Use experiment 1 to find kkk:
The units are found from rate÷[A]2\text{rate} \div [A]^2rate÷[A]2, giving dm³ mol⁻¹ s⁻¹.
Forgetting units of k
The units of kkk depend on the overall order. First order gives s⁻¹, second order gives dm³ mol⁻¹ s⁻¹, and third order gives dm⁶ mol⁻² s⁻¹.
3. How rate data are collected
Initial rates method
In the initial rates method, you carry out separate experiments with different starting concentrations and measure the starting rate each time. You must keep other variables constant, especially temperature, total volume and catalyst amount.
A clock reaction is an approximation to initial rates. You measure the time for a fixed visible change to happen. If the same small amount of product is made each time, then:
initial rate∝1t\text{initial rate} \propto \frac{1}{t}initial rate∝t1Continuous monitoring
In continuous monitoring, you follow one reaction mixture over time and plot concentration against time. Common methods include measuring gas volume, mass loss, pH, conductivity, or absorbance.
Colorimetry is useful when a coloured reactant or product is involved. A colorimeter measures absorbance; after calibration, absorbance can be converted into concentration.
4. Concentration–time graphs
A concentration–time graph shows how concentration changes during one experiment. Zero-order and first-order reactions have different shapes.
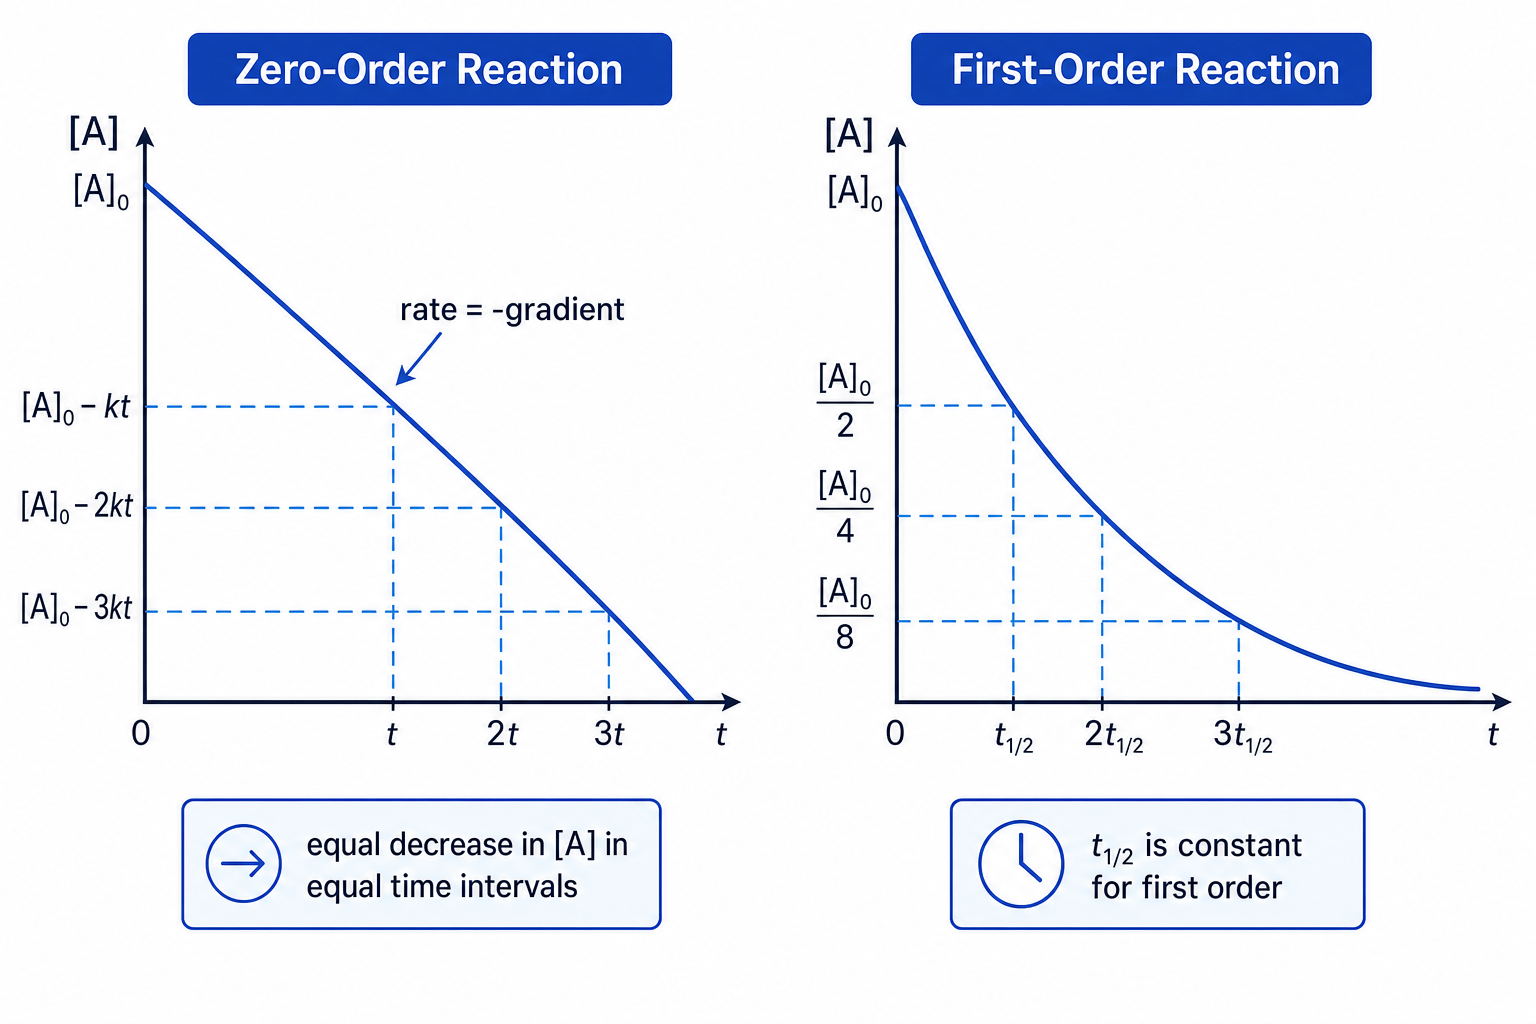
For a zero-order reaction with respect to a reactant, the concentration decreases in a straight line. The rate is constant until that reactant runs out.
For a first-order reaction, the curve becomes less steep as concentration decreases. The rate falls because the rate depends on the reactant concentration.
Calculating rate from a tangent
A tangent to a reactant concentration–time curve passes through these two points: 60.0 s, 0.760 mol dm⁻³ and 140.0 s, 0.520 mol dm⁻³.
- Calculate the gradient of the tangent:
-
Use the sign convention for a reactant: rate=−gradient\text{rate} = -\text{gradient}rate=−gradient.
-
The rate at that time is 3.00×10−33.00 \times 10^{-3}3.00×10⁻³ mol dm⁻³ s⁻¹.
5. Half-life for a first-order reaction
Half-life
The half-life, t1/2t_{1/2}t1/2, is the time taken for the concentration of a reactant to fall to half its previous value.
For a first-order reaction, the half-life is constant. This means the time for [A][A][A] to fall from 0.80 to 0.40 mol dm⁻³ is the same as from 0.40 to 0.20 mol dm⁻³.
For a first-order reaction:
k=ln2t1/2k = \frac{\ln 2}{t_{1/2}}k=t1/2ln2You are not required to derive this from the integrated first-order equation.
Calculating k from half-life
A first-order reaction has a half-life of 12.0 min. Calculate kkk in s⁻¹.
-
Convert the half-life into seconds: 12.0 min = 720 s.
-
Substitute into the first-order half-life equation:
- Because time was in seconds, k=9.63×10⁻⁴k = 9.63 \times 10^{-4}k=9.63×10⁻⁴ s⁻¹.
6. Rate–concentration graphs
A rate–concentration graph uses rate data from separate experiments, often initial rates experiments. It shows how rate changes as the concentration of one reactant changes.
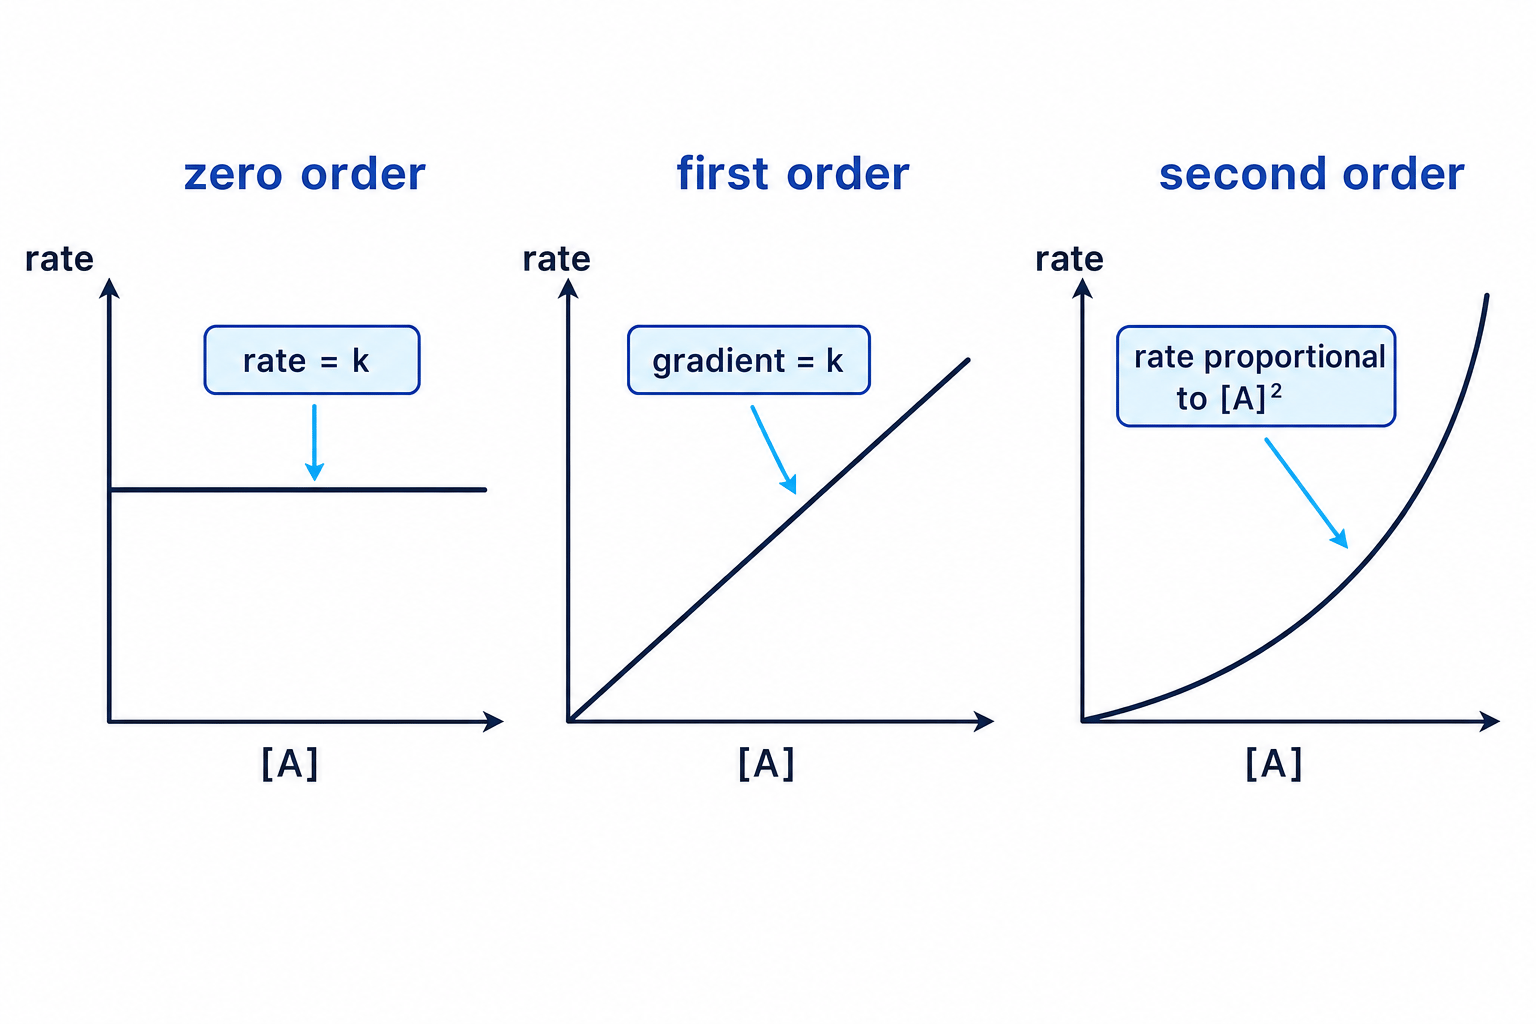
- Zero order: horizontal line; rate does not depend on concentration.
- First order: straight line through the origin; rate=k[A]\text{rate} = k[A]rate=k[A].
- Second order: curve through the origin; doubling concentration makes rate four times larger.
For a first-order rate–concentration graph, the gradient is kkk.
Finding k from a rate–concentration graph
A first-order rate–concentration graph for A passes through [A]=0.250[A] = 0.250[A]=0.250 mol dm⁻³ with rate 6.25×10−46.25 \times 10^{-4}6.25×10⁻⁴ mol dm⁻³ s⁻¹.
-
For first order, use rate=k[A]\text{rate} = k[A]rate=k[A], so k=rate/[A]k = \text{rate}/[A]k=rate/[A].
-
Substitute the graph value:
- The units are s⁻¹, so k=2.50×10⁻³k = 2.50 \times 10^{-3}k=2.50×10⁻³ s⁻¹.
A curved graph is not enough
A curved concentration–time graph does not automatically prove first order. For first order, look for constant half-life, or use a rate–concentration graph.
7. Rate-determining step and mechanisms
Rate-determining step
The rate-determining step is the slowest step in a multi-step reaction mechanism. It controls the overall rate.
The rate equation gives evidence about the species involved in the rate-determining step. A species that appears only in a later fast step will not appear in the rate equation.
Using a rate equation to support a mechanism
For the overall reaction:
NO2(g)+CO(g)→NO(g)+CO2(g)\text{NO}_2(g) + \text{CO}(g) \to \text{NO}(g) + \text{CO}_2(g)NO2(g)+CO(g)→NO(g)+CO2(g)The experimental rate equation is rate=k[NO2]2\text{rate} = k[\text{NO}_2]^2rate=k[NO2]2.
A possible mechanism is:
NO2(g)+NO2(g)→NO3(g)+NO(g)slowNO3(g)+CO(g)→NO2(g)+CO2(g)fast\begin{aligned} \text{NO}_2(g) + \text{NO}_2(g) &\to \text{NO}_3(g) + \text{NO}(g) \quad \text{slow} \\ \text{NO}_3(g) + \text{CO}(g) &\to \text{NO}_2(g) + \text{CO}_2(g) \quad \text{fast} \end{aligned}NO2(g)+NO2(g)NO3(g)+CO(g)→NO3(g)+NO(g)slow→NO2(g)+CO2(g)fast-
The slow step contains two molecules of NO2\text{NO}_2NO2, so it predicts rate=k[NO2]2\text{rate} = k[\text{NO}_2]^2rate=k[NO2]2.
-
Adding the two steps and cancelling species that appear on both sides gives the overall equation.
-
CO does not appear in the rate equation because it reacts after the slow step.
8. Temperature and the Arrhenius equation
Increasing temperature usually increases rate. Particles have more kinetic energy, so a larger fraction have energy at least equal to the activation energy, EaE_aEa. At fixed concentrations, an increased rate means the rate constant kkk has increased.
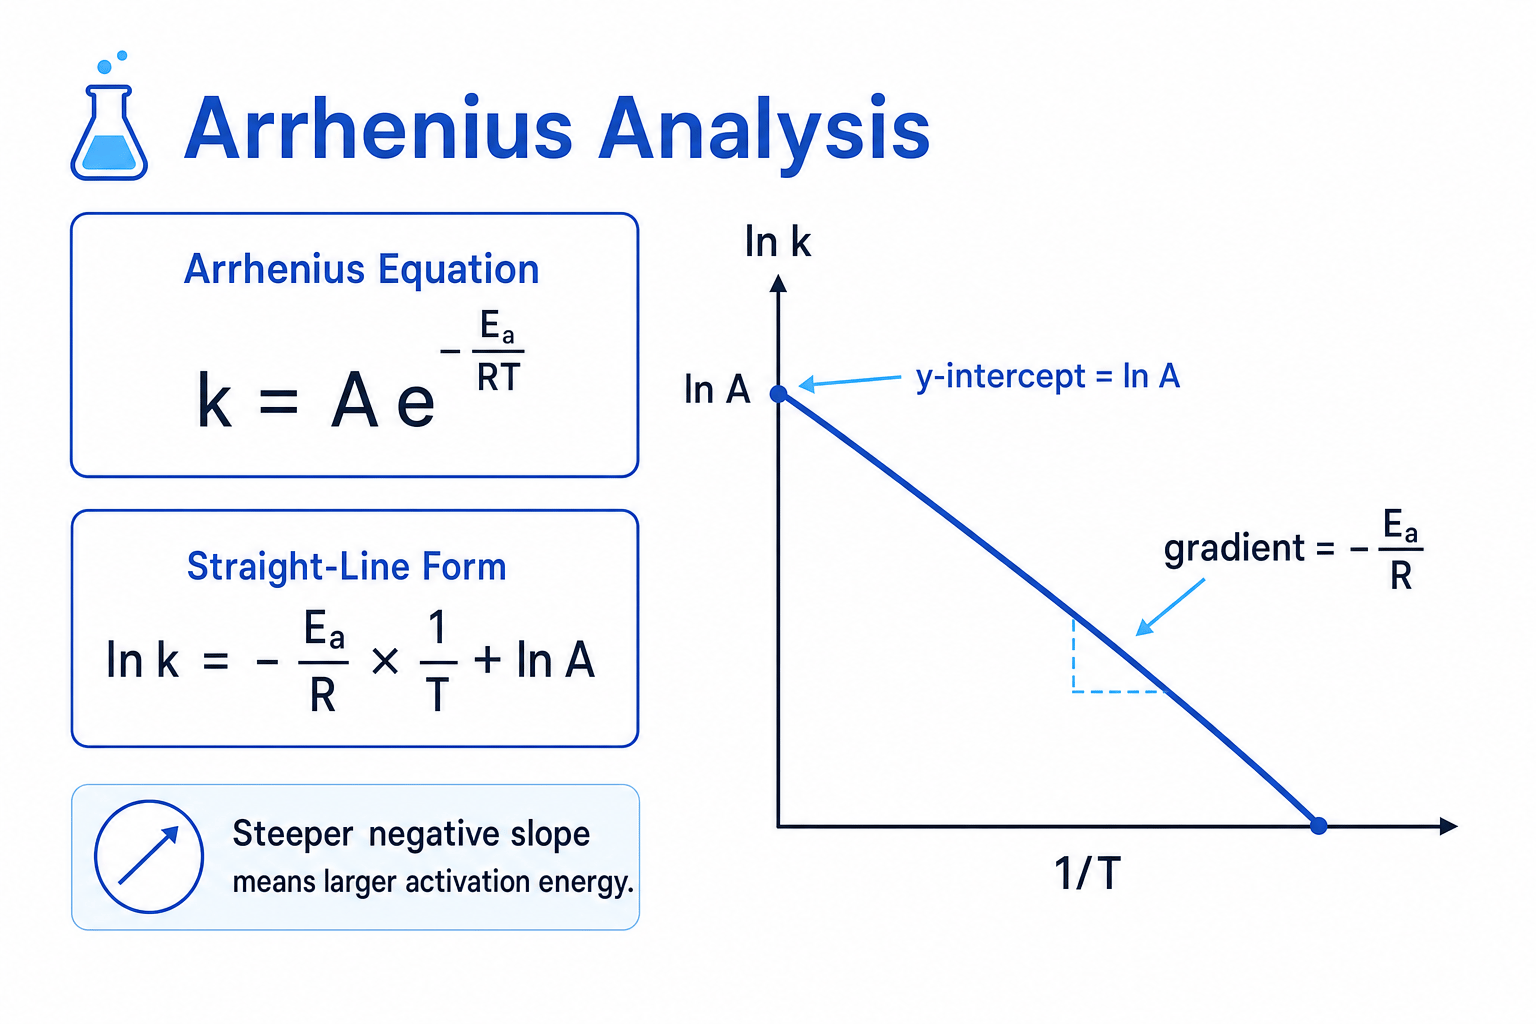
The Arrhenius equation links kkk and temperature:
k=Ae−Ea/RTk = Ae^{-E_a/RT}k=Ae−Ea/RTHere, EaE_aEa is activation energy, TTT is temperature in K, RRR is the gas constant, and AAA is the pre-exponential factor. You do not need to explain what AAA means.
The straight-line form is:
lnk=−EaR(1T)+lnA\ln k = -\frac{E_a}{R}\left(\frac{1}{T}\right) + \ln Alnk=−REa(T1)+lnASo a graph of lnk\ln klnk against 1/T1/T1/T has gradient −Ea/R-E_a/R−Ea/R and intercept lnA\ln AlnA.
Finding activation energy from an Arrhenius plot
An Arrhenius plot has gradient −5.20×10³-5.20 \times 10^3−5.20×10³ K and intercept 18.7 for a first-order reaction.
- Use gradient=−Ea/R\text{gradient} = -E_a/Rgradient=−Ea/R:
- Calculate and convert units:
- Use lnA=18.7\ln A = 18.7lnA=18.7, so A=e18.7=1.32×10⁸A = e^{18.7} = 1.32 \times 10^8A=e18.7=1.32×10⁸ s⁻¹, because this is a first-order reaction.
In the exam
-
When comparing initial rates, only compare experiments where one concentration changes and all others stay constant.
-
For graph questions, identify the graph type first: concentration–time uses gradients/half-lives, while rate–concentration gives orders from shape.
-
For Arrhenius calculations, use temperature in K and keep EaE_aEa in J mol⁻¹ until the final conversion to kJ mol⁻¹.
Check yourself
- If doubling [A][A][A] causes the rate to quadruple, what is the order with respect to A?
- Why is the half-life constant for a first-order reaction but not for a zero-order reaction?
- How can a rate equation provide evidence for a proposed reaction mechanism?
