

What you'll learn
- How infrared (IR) radiation interacts with covalent bonds.
- How to use IR spectra to identify alcohols, carbonyl compounds and carboxylic acids.
- How mass spectra give molecular mass and fragment-ion clues.
- How to combine elemental analysis, IR and mass spectrometry to deduce organic structures.
The big idea: using evidence to identify molecules
An analytical technique is a method used to find out what a substance is made of, or how much of a substance is present.
In organic chemistry, one piece of evidence is rarely enough. You often combine:
- IR spectroscopy to identify important bonds and functional groups.
- Mass spectrometry to find molecular mass and fragments of the molecule.
- Elemental analysis to work out the empirical formula.
Functional group
A functional group is the atom or group of atoms in an organic molecule responsible for its characteristic reactions, for example –OH in alcohols or C=O in aldehydes and ketones.
Infrared spectroscopy
Covalent bonds vibrate
Infrared radiation is part of the electromagnetic spectrum. Its energy is similar to the energy needed to make covalent bonds vibrate more.
A covalent bond behaves a bit like a tiny spring between atoms. It can stretch, bend and vibrate. When a bond absorbs IR radiation of the right frequency, the vibration becomes stronger.
Infrared absorption
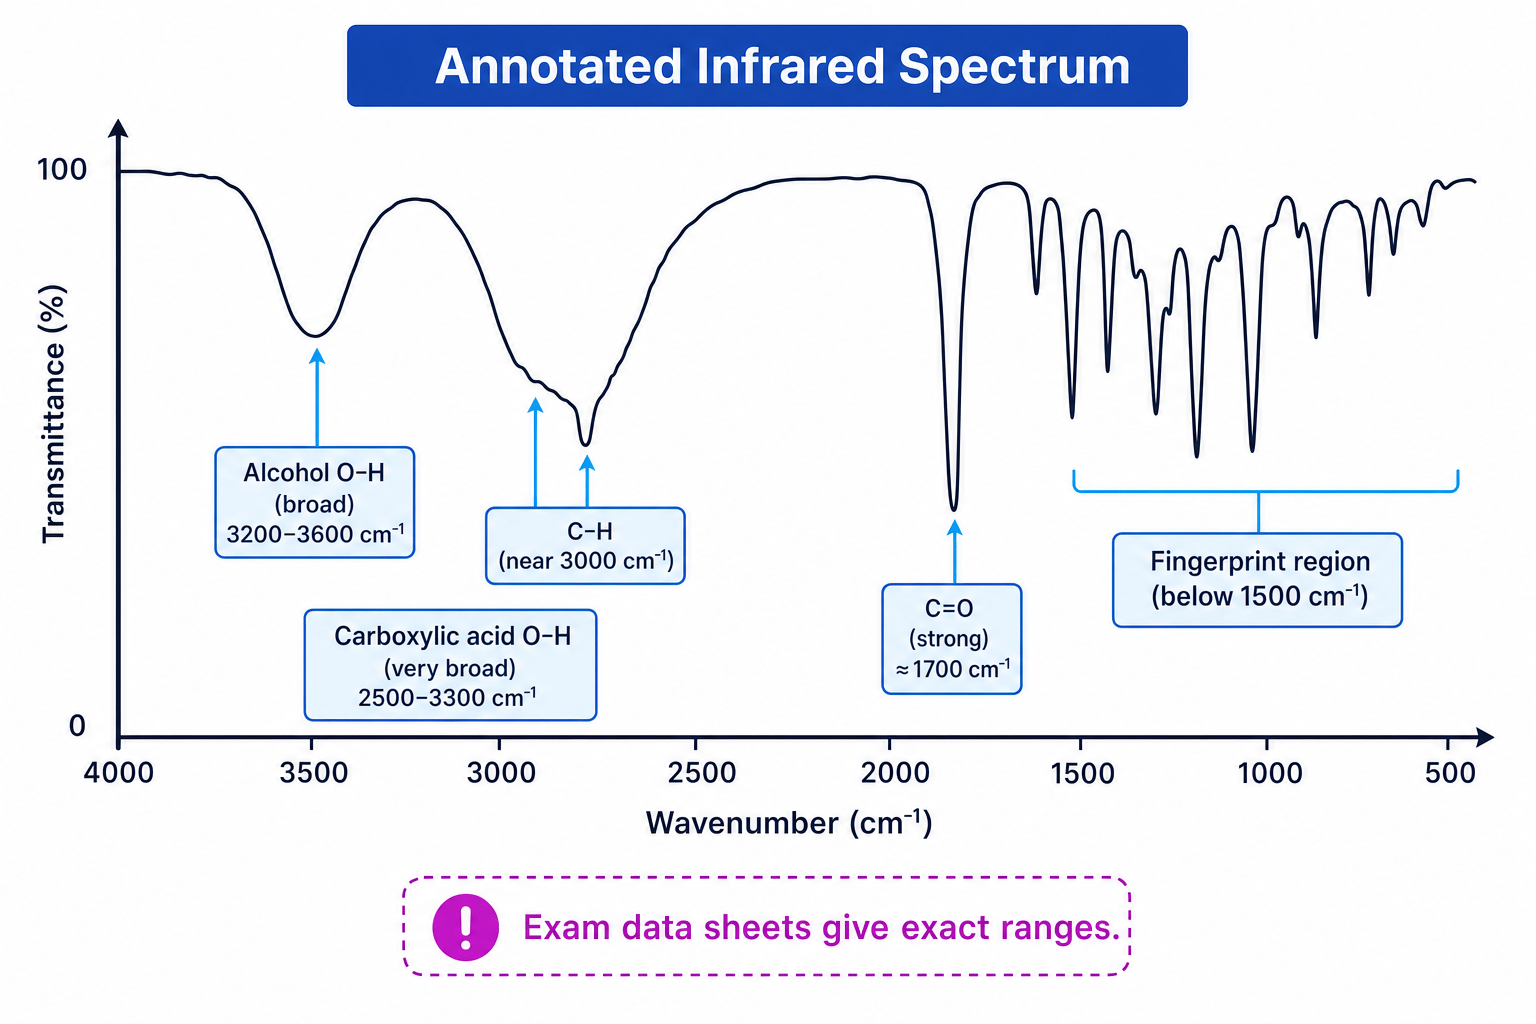
In IR spectroscopy, a covalent bond absorbs infrared radiation when the radiation frequency matches a vibration of that bond. The absorption is recorded as a peak, usually shown as a downward dip in transmittance.
IR spectra usually plot:
- Transmittance on the vertical axis: how much IR passes through the sample.
- Wavenumber on the horizontal axis, measured in cm⁻¹.
A higher wavenumber means higher energy radiation. The horizontal axis often runs from about 4000 cm⁻¹ on the left down to about 500 cm⁻¹ on the right.
Reading an IR spectrum
Different bonds absorb IR at different wavenumbers. In the exam, the exact absorption data will be given on the Data Sheet, so your job is to match peaks to the data carefully.
For this section, the most important absorptions are:
- Alcohol O–H bond: broad absorption around 3200–3600 cm⁻¹.
- Aldehyde or ketone C=O bond: strong absorption around 1640–1750 cm⁻¹.
- Carboxylic acid: strong C=O absorption plus a very broad O–H absorption around 2500–3300 cm⁻¹.
- C–H bonds: most organic compounds show a peak around 3000 cm⁻¹.
IR identifies bonds
IR spectroscopy is best for identifying bonds and functional groups, not usually a complete structure on its own.
Identifying a carboxylic acid from IR data
An unknown organic compound has a strong absorption at 1710 cm⁻¹, a very broad absorption from 2500–3300 cm⁻¹, and C–H absorptions near 3000 cm⁻¹.
- Compare 1710 cm⁻¹ with the Data Sheet: it lies in the C=O absorption range, so the molecule contains a carbonyl group.
- The very broad absorption from 2500–3300 cm⁻¹ matches the O–H bond in a carboxylic acid, rather than the narrower alcohol O–H absorption.
- A compound with both C=O and the very broad acid O–H absorption is identified as a carboxylic acid. The C–H peak near 3000 cm⁻¹ is not very diagnostic because most organic molecules contain C–H bonds.
Overusing the C–H peak
A peak near 3000 cm⁻¹ usually just tells you that C–H bonds are present. Since most organic compounds contain C–H bonds, this peak rarely identifies a functional group by itself.
Predicting an IR spectrum
When predicting the IR spectrum of a molecule, work from the structure:
- Identify the functional group.
- List the key bonds it contains.
- Predict the important absorptions using the Data Sheet.
- Also notice which peaks should be absent.
For example, ethanol, CH₃CH₂OH, should show a broad alcohol O–H absorption and C–H absorptions, but no C=O absorption.
For an unfamiliar substance, OCR will restrict the interpretation to functional groups studied in the specification, and absorption data will be supplied.
IR spectroscopy and atmospheric gases
Some atmospheric gases absorb IR radiation because they contain bonds such as C=O, O–H and C–H. Examples include:
- carbon dioxide, CO₂
- water vapour, H₂O
- methane, CH₄
The Earth absorbs energy from the Sun and then emits some energy back as IR radiation. Greenhouse gases absorb some of this outgoing IR radiation and re-emit it, contributing to warming of the atmosphere.
This absorption of IR radiation is part of the scientific evidence linking increased greenhouse gas concentrations with global warming. Acceptance of this evidence has influenced government policies, including moves towards renewable energy supplies and reduced fossil-fuel use.
Why IR matters beyond the lab
IR absorption is not just a way to identify organic compounds; it also explains how important atmospheric gases interact with heat radiation from the Earth.
IR in pollution monitoring and breathalysers
IR spectroscopy can also be used to monitor gases causing air pollution. For example, carbon monoxide, CO, and nitrogen monoxide, NO, from vehicle emissions absorb IR at characteristic frequencies.
Modern breathalysers can use IR absorption to measure ethanol vapour in a person’s breath. The instrument is calibrated using known ethanol concentrations, then compares the breath sample with those standards.
This matters because analytical evidence can be used in law courts, for example in drink-driving cases.
Mass spectrometry
What a mass spectrum shows
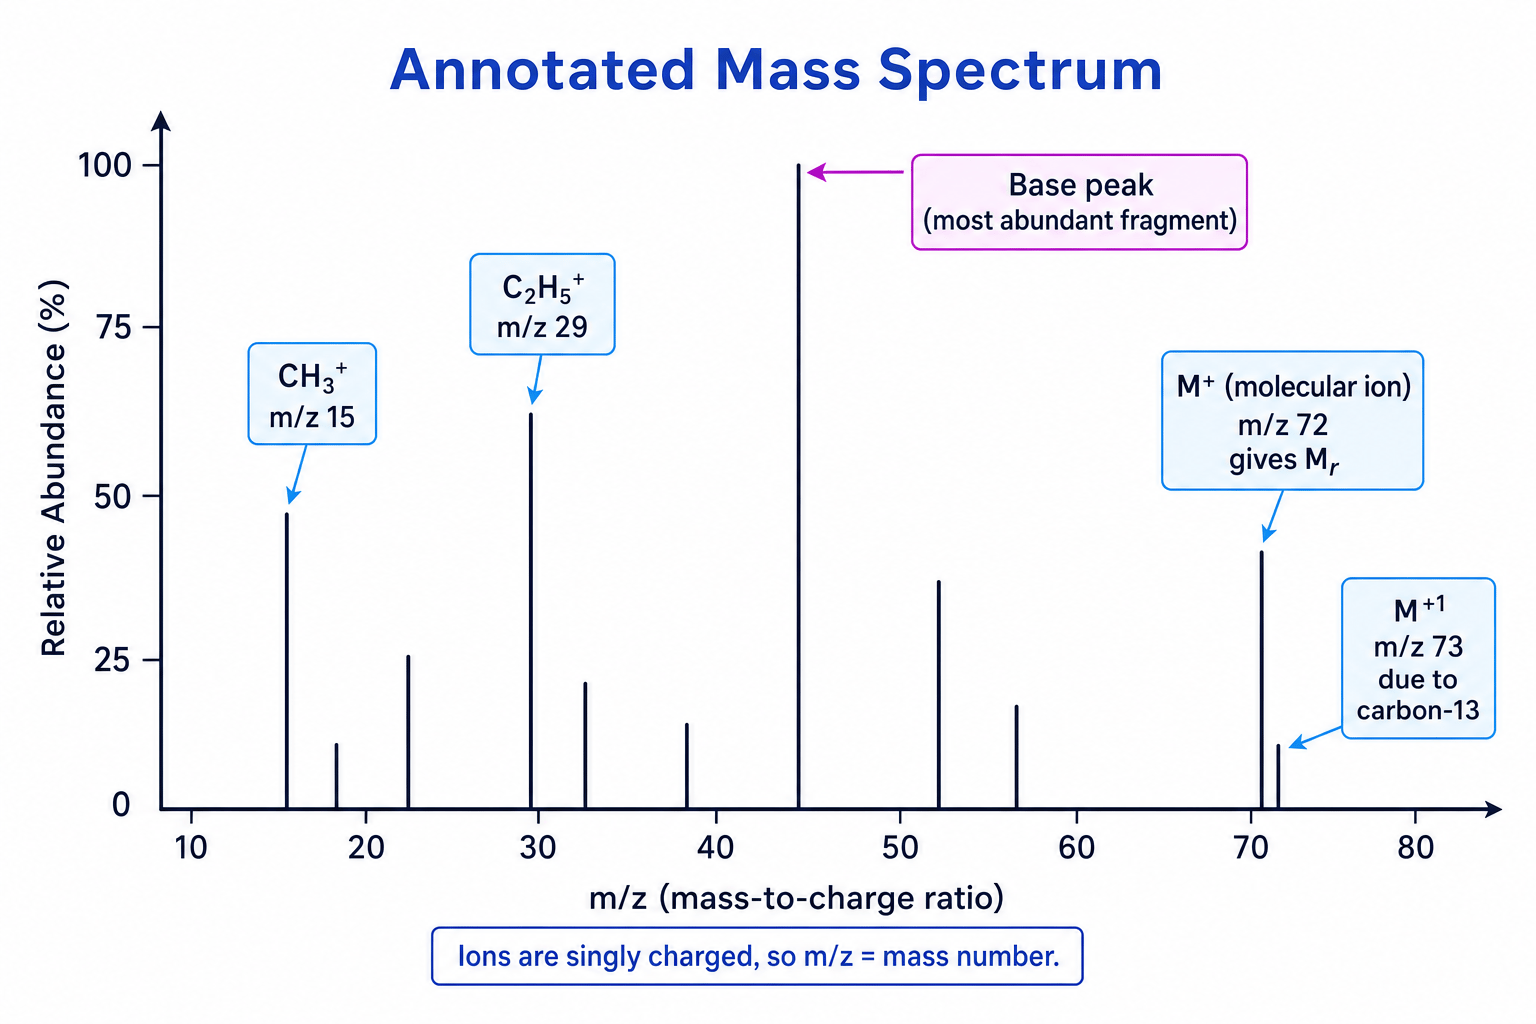
Mass spectrometry is an analytical technique in which molecules are ionised, separated according to their mass-to-charge ratio, and detected.
Mass-to-charge ratio
The mass-to-charge ratio, written as m/zm/zm/z, compares the mass of an ion with its charge. In this OCR topic, ions are limited to single positive charges, so m/zm/zm/z is effectively the relative mass of the ion.
A mass spectrum plots:
- Relative abundance on the vertical axis.
- m/zm/zm/z on the horizontal axis.
The molecular ion peak
When a molecule loses one electron but stays in one piece, it forms the molecular ion, often written as M⁺.
Molecular ion peak
The molecular ion peak is the peak caused by the ion of the whole molecule. For singly charged ions, its m/zm/zm/z value gives the relative molecular mass, MrM_rMr.
You may also see a small M+1 peak, one unit higher than the molecular ion peak. This is caused by the small natural abundance of carbon-13 atoms.
Finding molecular mass from a mass spectrum
A mass spectrum has a molecular ion peak at m/z=74m/z = 74m/z=74 and a much smaller peak at m/z=75m/z = 75m/z=75.
- Identify the small peak one unit above the main molecular ion as an M+1 peak, caused mainly by carbon-13.
- Use the molecular ion peak at m/z=74m/z = 74m/z=74, not the M+1 peak, to find the molecular mass.
- Since the ions are singly charged, the relative molecular mass is Mr=74M_r = 74Mr=74.
Halogen isotope patterns
You will not be expected to interpret mass spectra of organic halogen compounds in this section, so do not worry here about chlorine or bromine M+2 isotope patterns.
Fragmentation peaks
The molecular ion can break apart. This is called fragmentation. A positive fragment ion is detected, while any neutral fragment is not detected.
For example:
CH3CH2OH+∙→CH2OH++CH3∙\mathrm{CH_3CH_2OH^{+\bullet} \to CH_2OH^+ + CH_3^\bullet}CH3CH2OH+∙→CH2OH++CH3∙The peak at m/z=31m/z = 31m/z=31 could be due to the fragment ion CH₂OH⁺.
Common useful fragment ions include:
- m/z=15m/z = 15m/z=15: CH₃⁺
- $m/z = 29`: C₂H₅⁺ or CHO⁺
- $m/z = 31`: CH₂OH⁺
- $m/z = 43`: C₃H₇⁺ or CH₃CO⁺
- $m/z = 45`: COOH⁺
A single m/zm/zm/z value may match more than one possible fragment, so you should combine fragment evidence with the molecular formula and IR spectrum.
Suggesting fragment ions
Ethanol, CH₃CH₂OH, has a mass spectrum with important peaks at m/z=31m/z = 31m/z=31 and m/z=15m/z = 15m/z=15.
- Calculate the mass of CH₂OH⁺: carbon contributes 12, three hydrogens contribute 3, and oxygen contributes 16, giving a total of 31.
- Therefore, the peak at m/z=31m/z = 31m/z=31 can be assigned to CH₂OH⁺, which contains the alcohol part of ethanol.
- The peak at m/z=15m/z = 15m/z=15 can be assigned to CH₃⁺, formed when the C–C bond in ethanol breaks during fragmentation.
Combining analytical techniques
Elemental analysis gives an empirical formula
Elemental analysis gives the percentage by mass of each element in a compound.
Empirical formula
The empirical formula is the simplest whole-number ratio of atoms of each element in a compound.
To calculate an empirical formula from percentage composition:
- Assume you have 100 g of the compound.
- Convert each element’s mass into amount using n=m/Mn = m/Mn=m/M.
- Divide all amounts by the smallest amount.
- Scale to whole numbers if needed.
Then use the molecular ion peak from mass spectrometry to find the molecular formula.
Deducing ethanol from combined data
An organic compound contains 52.2% carbon, 13.0% hydrogen and 34.8% oxygen by mass. Its mass spectrum has a molecular ion peak at m/z=46m/z = 46m/z=46, with fragment peaks at m/z=31m/z = 31m/z=31 and m/z=15m/z = 15m/z=15. Its IR spectrum shows a broad absorption at 3200–3600 cm⁻¹ and no strong absorption near 1700 cm⁻¹.
- Assume 100 g of compound and convert each mass into amount: carbon gives 52.2÷12.0=4.3552.2 \div 12.0 = 4.3552.2÷12.0=4.35 mol, hydrogen gives 13.0÷1.0=13.013.0 \div 1.0 = 13.013.0÷1.0=13.0 mol, and oxygen gives 34.8÷16.0=2.1834.8 \div 16.0 = 2.1834.8÷16.0=2.18 mol.
- Divide by the smallest amount: C gives 4.35÷2.18≈2.004.35 \div 2.18 \approx 2.004.35÷2.18≈2.00, H gives 13.0÷2.18≈5.9613.0 \div 2.18 \approx 5.9613.0÷2.18≈5.96, and O gives 2.18÷2.18=1.002.18 \div 2.18 = 1.002.18÷2.18=1.00, so the empirical formula is C₂H₆O.
- The empirical formula mass is 46.0, which matches the molecular ion peak at m/z=46m/z = 46m/z=46, so the molecular formula is C₂H₆O.
- The broad IR absorption at 3200–3600 cm⁻¹ shows an alcohol O–H bond, and the absence of a strong peak near 1700 cm⁻¹ rules out a C=O group.
- The fragment peaks support the structure: m/z=31m/z = 31m/z=31 can be CH₂OH⁺ and m/z=15m/z = 15m/z=15 can be CH₃⁺, consistent with ethanol, CH₃CH₂OH.
Best order for structure questions
Use elemental analysis for the formula, the molecular ion peak for MrM_rMr, IR for functional groups, and fragmentation peaks for pieces of the carbon skeleton.
In the exam
- Always use the Data Sheet for IR ranges; do not rely on rough memory if exact data are provided.
- For mass spectra, ignore a small M+1 peak when finding MrM_rMr and use the main molecular ion peak.
- Combine evidence: a formula, an IR peak or a fragment peak alone may not uniquely identify the structure.
Check yourself
- How would you distinguish an alcohol from a carboxylic acid using IR spectroscopy?
- Why does a small M+1 peak not usually give the relative molecular mass?
- What information does elemental analysis provide before you use the mass spectrum?
