

What you'll learn
- Explain reaction rates using collision theory, activation energy and the Boltzmann distribution.
- Calculate rates from experimental data, including graph gradients.
- Describe how concentration, temperature and catalysts affect rate.
- Use and evaluate gas collection, precipitation, colorimetry and iodine clock methods.
What “rate of reaction” means
A reaction rate tells you how quickly reactants are used up or products are formed. In practical work, you rarely “see moles reacting” directly, so you measure something linked to amount: gas volume, mass, colour intensity, cloudiness, or concentration.
Rate of reaction
The rate of reaction is the change in amount or concentration of a reactant or product per unit time.
For a measured quantity such as gas volume:
mean rate=ΔVΔt\text{mean rate}=\frac{\Delta V}{\Delta t}mean rate=ΔtΔVCommon units include cm³ s⁻¹ for gas volume, g s⁻¹ for mass change, and mol dm⁻³ s⁻¹ for concentration change.
If you use a reactant concentration, the value decreases during the reaction, so chemists often use a positive rate by writing the change in reactant concentration as a loss.
Measuring gas volume over time
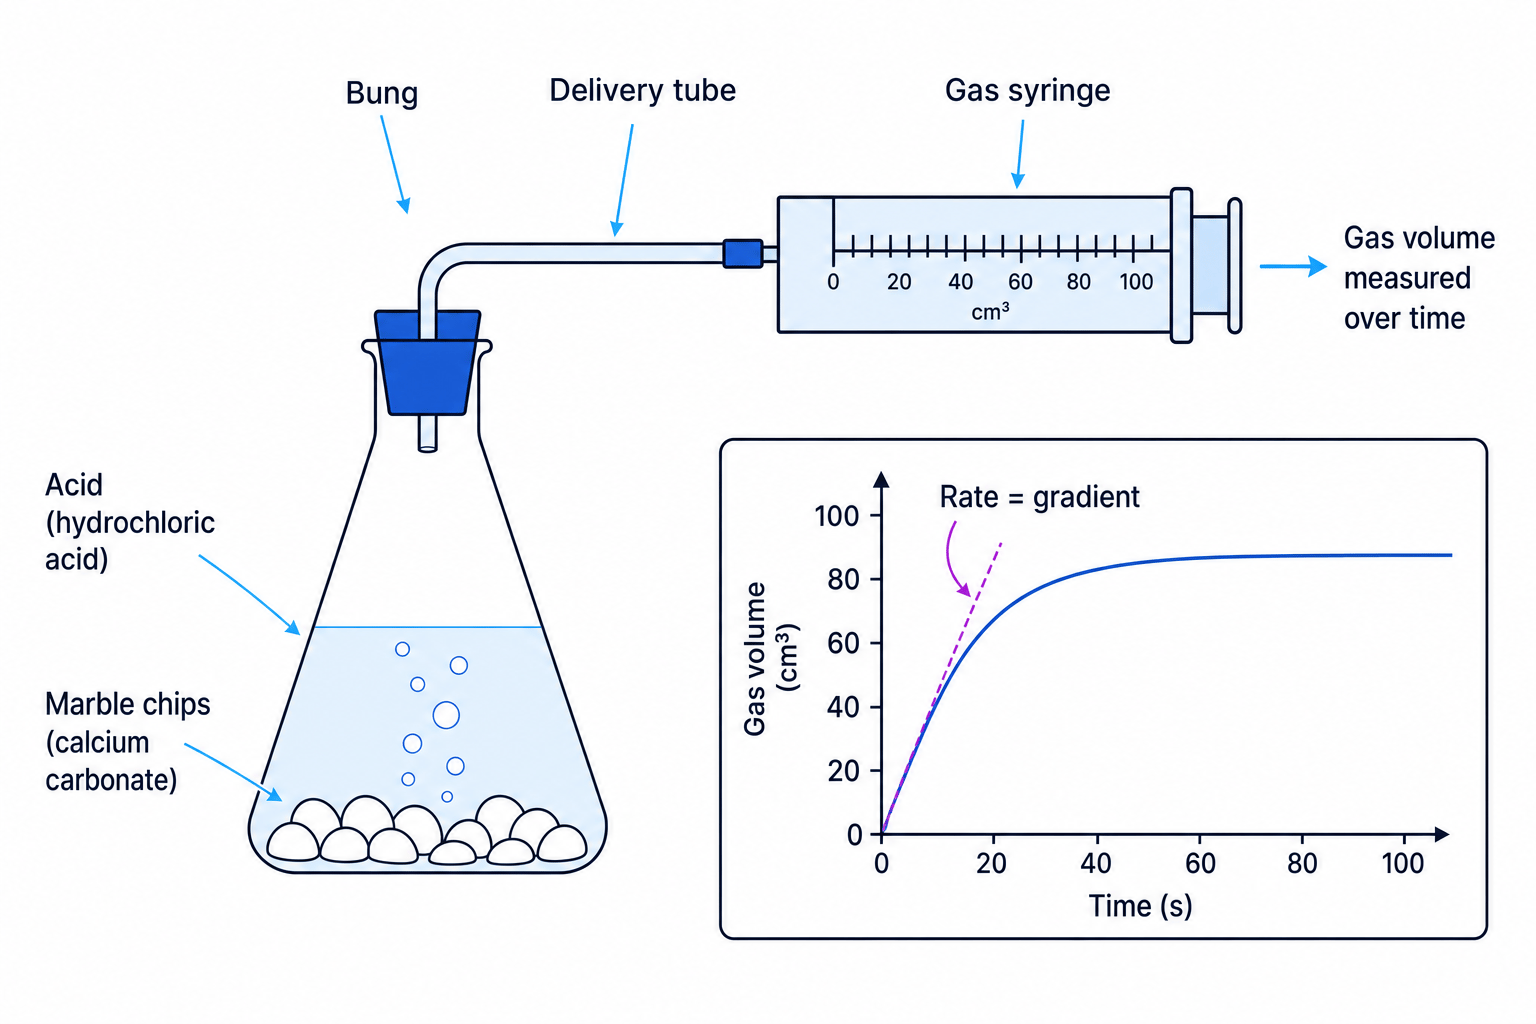
A classic Eduqas practical is reacting calcium carbonate with hydrochloric acid and collecting carbon dioxide:
CaCO₃(s) + 2HCl(aq) → CaCl₂(aq) + H₂O(l) + CO₂(g)
You record the volume of CO₂ at regular time intervals, then plot gas volume against time. The gradient gives the rate.
Calculating a mean rate from gas data
In a reaction, 60.0 cm³ of CO₂ is collected in the first 40.0 s. Calculate the mean rate over this interval.
-
Choose the measured quantity and the time interval: gas volume changes by 60.0 cm³ over 40.0 s.
-
Substitute into the rate expression:
mean rate=ΔVΔt=60.0 cm340.0 s\text{mean rate}=\frac{\Delta V}{\Delta t}=\frac{60.0\ \text{cm}^3}{40.0\ \text{s}}mean rate=ΔtΔV=40.0 s60.0 cm3 -
Calculate and include units:
mean rate=1.50 cm3 s−1\text{mean rate}=1.50\ \text{cm}^3\ \text{s}^{-1}mean rate=1.50 cm3 s−1
Mean rate and instantaneous rate
A mean rate is averaged over a chosen time interval. An instantaneous rate is the rate at one particular moment.
On a curved graph, the instantaneous rate is found from the gradient of a tangent drawn to the curve at that time.
Gradient reminder
For a tangent line, use two well-separated points on the tangent, not on the curve unless they actually lie on the tangent:
gradient=change in ychange in x\text{gradient}=\frac{\text{change in y}}{\text{change in x}}gradient=change in xchange in yUsing the whole curve for an instantaneous rate
For the rate at 20 s, do not calculate total volume divided by 20 s unless the question asks for a mean rate from 0 to 20 s. Draw a tangent at 20 s and find its gradient.
Collision theory
Collision theory
Collision theory explains reaction rate by saying particles must collide with the correct orientation and with energy at least equal to the activation energy for a reaction to occur.
A collision that leads to reaction is called a successful collision. Rate increases when successful collisions happen more often.
Changing conditions
- Increasing concentration in solution gives more particles per unit volume, so collisions are more frequent.
- Increasing pressure for gases gives more gas particles per unit volume, so collisions are more frequent.
- Increasing surface area of a solid exposes more particles to collisions.
- Increasing temperature makes particles move faster and, more importantly, greatly increases the fraction with enough energy to react.
- Adding a catalyst provides a different route with lower activation energy.
The collision theory shortcut
A reaction gets faster when either collisions happen more frequently, or a larger fraction of collisions have enough energy and the correct orientation to be successful.
Concentration and rate
To investigate how concentration affects rate, vary one reactant concentration while keeping other variables constant: temperature, total volume, surface area, and concentrations of other reactants.
The initial rate is often used because concentrations have not yet changed much, so comparisons between experiments are cleaner.
At this level, you may be asked to establish the relationship from data or a graph. For example, a straight-line graph through the origin for rate against concentration means rate is directly proportional to concentration.
Establishing a concentration-rate relationship
A reaction is tested at different concentrations of reactant A while all other conditions are kept constant.
- At 0.020 mol dm⁻³, the initial rate is 1.2×10−51.2 \times 10^{-5}1.2×10⁻⁵ mol dm⁻³ s⁻¹.
- At 0.040 mol dm⁻³, the initial rate is 2.4×10−52.4 \times 10^{-5}2.4×10⁻⁵ mol dm⁻³ s⁻¹.
- At 0.060 mol dm⁻³, the initial rate is 3.6×10−53.6 \times 10^{-5}3.6×10⁻⁵ mol dm⁻³ s⁻¹.
-
Compare the first two experiments: concentration doubles from 0.020 to 0.040 mol dm⁻³.
-
Compare the rates: the rate also doubles from 1.2×10−51.2 \times 10^{-5}1.2×10⁻⁵ to 2.4×10−52.4 \times 10^{-5}2.4×10⁻⁵ mol dm⁻³ s⁻¹.
-
Check the third experiment: increasing concentration from 0.020 to 0.060 mol dm⁻³ is a factor of 3, and the rate also increases by a factor of 3.
-
Conclude that, over this range, rate is directly proportional to the concentration of A.
Do not assume from the balanced equation
The relationship between concentration and rate is experimental. You cannot safely deduce it just from the stoichiometric coefficients in the balanced equation.
Energy profiles and activation energy
Activation energy
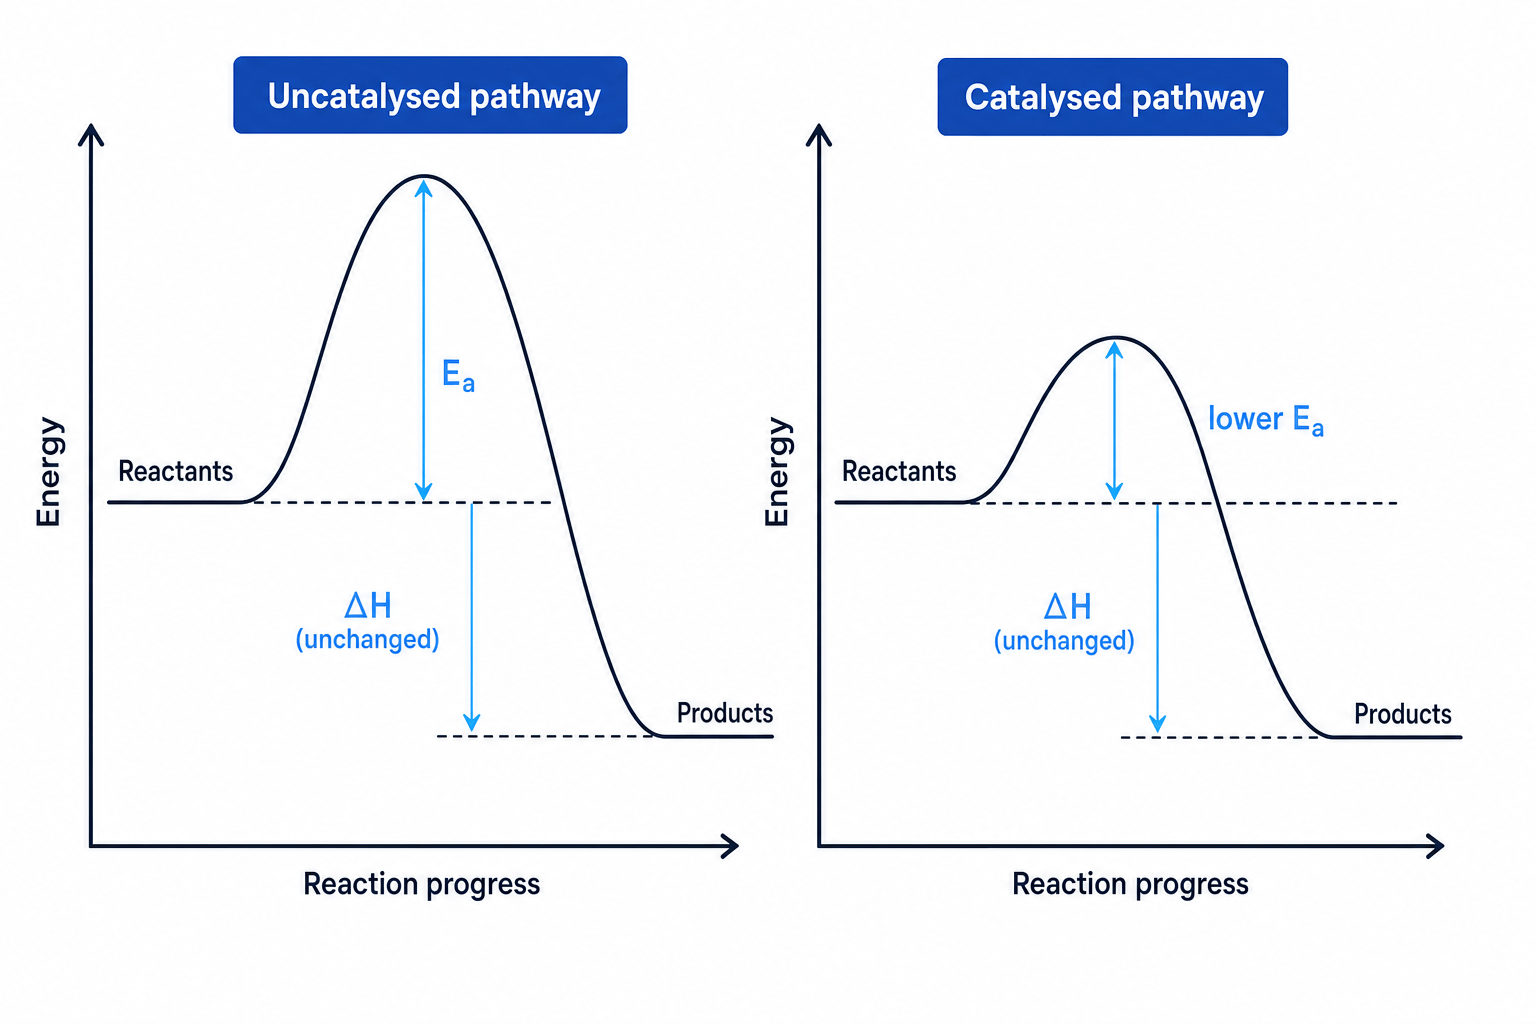
The activation energy, EaE_aEa, is the minimum energy that colliding particles must have for a successful reaction.
An energy profile shows how energy changes as reactants become products. The vertical gap from reactants to the peak is the activation energy. The vertical gap from reactants to products is the enthalpy change, ΔH\Delta HΔH.
Reading values from an energy profile
A reaction has reactants at 40 kJ mol⁻¹, products at 15 kJ mol⁻¹, and an uncatalysed peak at 110 kJ mol⁻¹. With a catalyst, the peak is 70 kJ mol⁻¹. Find ΔH\Delta HΔH and both activation energies.
-
Calculate the enthalpy change using products minus reactants:
ΔH=15−40=−25 kJ mol−1\Delta H=15-40=-25\ \text{kJ mol}^{-1}ΔH=15−40=−25 kJ mol−1The reaction is exothermic.
-
Calculate the uncatalysed activation energy:
Ea=110−40=70 kJ mol−1E_a=110-40=70\ \text{kJ mol}^{-1}Ea=110−40=70 kJ mol−1 -
Calculate the catalysed activation energy:
Ea=70−40=30 kJ mol−1E_a=70-40=30\ \text{kJ mol}^{-1}Ea=70−40=30 kJ mol−1 -
Compare the pathways: the catalyst lowers EaE_aEa but ΔH\Delta HΔH stays −25 kJ mol⁻¹.
Temperature and the Boltzmann distribution
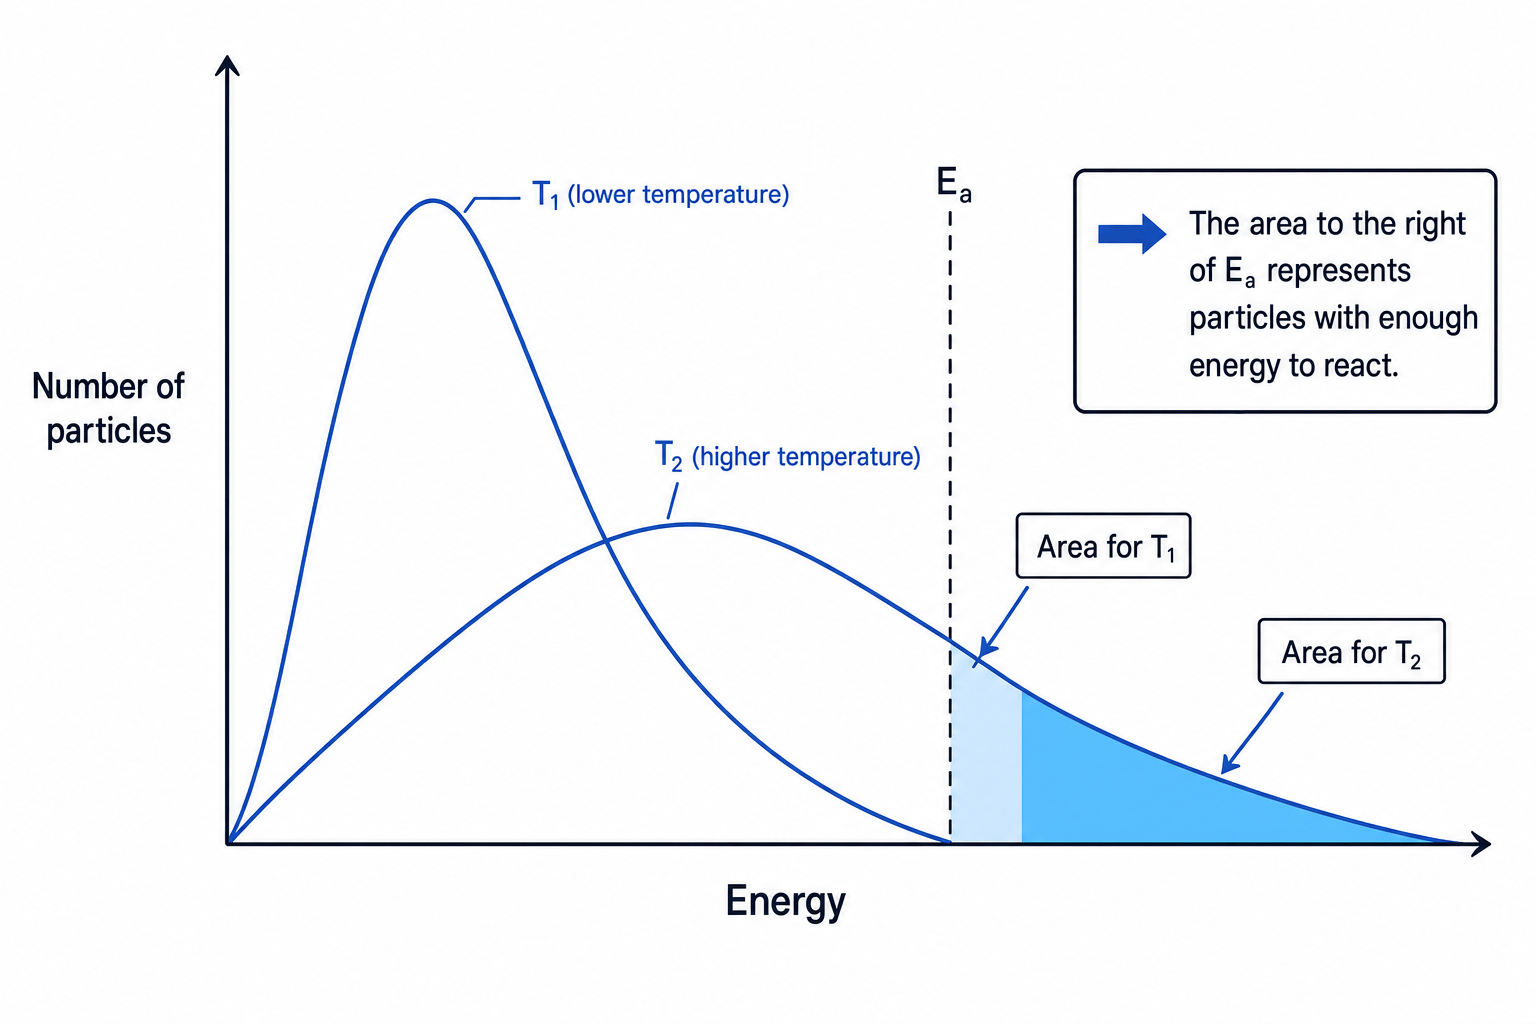
The Boltzmann distribution shows the spread of particle energies in a sample at a given temperature. The area under the curve represents the total number of particles.
At higher temperature, the curve becomes lower and broader, with the peak shifted to higher energy. The crucial change is the larger area to the right of EaE_aEa: many more particles now have enough energy to react.
Why temperature has a big effect
A small temperature increase causes only a modest increase in collision frequency, but it can cause a large increase in the fraction of particles with energy greater than EaE_aEa. That is why rate often rises rapidly with temperature.
Catalysts
Catalyst
A catalyst increases the rate of a reaction without being used up overall. It provides an alternative reaction pathway with lower activation energy.
A catalyst does not change the overall reaction equation, the enthalpy change, or the amount of product possible. In reversible reactions, it speeds up both forward and reverse reactions, so equilibrium is reached faster but the equilibrium position is not changed.
Saying catalysts give particles more energy
A catalyst does not increase particle energy. It lowers the activation energy, so a greater fraction of existing collisions are successful.
Practical methods for studying rates
Gas collection method
Use this when a gas is produced. For example, calcium carbonate and hydrochloric acid produce CO₂.
A good method:
- Measure a fixed volume and concentration of acid.
- Add a known mass of calcium carbonate with controlled chip size.
- Quickly seal the flask with a bung connected to a gas syringe.
- Record gas volume at regular time intervals.
- Plot gas volume against time and calculate gradients.
Important controls include temperature, acid concentration, acid volume, mass of solid, and surface area of the solid.
Losing gas before the bung is fitted
If gas escapes before the apparatus is sealed, the early data will be too low and the calculated initial rate may be unreliable. Add the solid and fit the bung as quickly and consistently as possible.
Precipitation method
Use this when an insoluble solid forms and makes the mixture cloudy. A common example is sodium thiosulfate reacting with hydrochloric acid:
Na₂S₂O₃(aq) + 2HCl(aq) → 2NaCl(aq) + SO₂(g) + S(s) + H₂O(l)
The sulfur precipitate makes the mixture cloudy. You can place the flask over a cross and time how long it takes for the cross to disappear. If the same visual endpoint is used each time, the rate can be estimated using:
relative rate=1t\text{relative rate}=\frac{1}{t}relative rate=t1This method is simple, but the endpoint is subjective. Lighting, observer judgement, solution depth and background markings can all affect the measured time.
Colorimetry
Colorimetry
Colorimetry measures how much light a coloured solution absorbs or transmits. If absorbance is linked to concentration, it can be used to follow concentration changes during a reaction.
In a colorimetry rate experiment, you choose a suitable filter, zero the colorimeter with a blank, then record absorbance at regular intervals. A calibration curve can convert absorbance into concentration.
Colorimetry is useful when a coloured reactant is used up or a coloured product forms. It is more objective than judging a colour change by eye.
Choosing the filter
Use a filter with a colour complementary to the solution colour so the solution absorbs strongly and the readings change clearly during the reaction.
Iodine clock reaction
An iodine clock measures the time taken to produce a fixed amount of iodine. A common version uses iodide ions and peroxodisulfate ions:
S₂O₈²⁻(aq) + 2I⁻(aq) → 2SO₄²⁻(aq) + I₂(aq)
A small, fixed amount of thiosulfate is added to remove iodine as soon as it forms:
I₂(aq) + 2S₂O₃²⁻(aq) → 2I⁻(aq) + S₄O₆²⁻(aq)
When all the thiosulfate has been used up, iodine remains and reacts with starch to give a sudden blue-black colour. Because the same amount of thiosulfate is used each time, the same amount of iodine is needed to reach the endpoint, so 1/t1/t1/t is used as a relative rate.
Using iodine clock times
In an iodine clock experiment, the concentration of iodide ions is changed while all other variables are kept constant.
- 0.010 mol dm⁻³ iodide gives a blue-black colour after 96 s.
- 0.020 mol dm⁻³ iodide gives a blue-black colour after 48 s.
- 0.040 mol dm⁻³ iodide gives a blue-black colour after 24 s.
-
Convert each time into a relative rate using 1/t1/t1/t: shorter time means faster reaction.
-
Compare the first two experiments: iodide concentration doubles and time halves, so 1/t1/t1/t doubles.
-
Compare the second and third experiments: iodide concentration doubles again and time halves again, so 1/t1/t1/t doubles again.
-
Conclude that the rate is directly proportional to iodide concentration under these conditions.
In the exam
-
For rate calculations, state what quantity is changing and divide by time; include units such as cm³ s⁻¹ or mol dm⁻³ s⁻¹.
-
For graph questions, use gradients: tangent gradients for instantaneous rates and chord gradients for mean rates.
-
For explanations, link the condition change to collision frequency, fraction of particles above EaE_aEa, or lower activation energy from a catalyst.
Check yourself
- Why does increasing temperature usually have a much larger effect than just making particles collide slightly more often?
- How would you use a volume-time graph to find the rate at exactly 30 s?
- In an iodine clock experiment, why is 1/t1/t1/t used as a relative rate rather than just using the time directly?
