

What you'll learn
- How mass spectra give molecular mass and fragmentation clues.
- How IR spectra identify functional groups from bond absorptions.
- How ¹³C NMR and low-resolution ¹H NMR reveal chemical environments.
- How to combine several spectra to deduce an organic structure.
Big picture: why instrumental analysis?
Instrumental analysis uses machines to identify or measure substances by detecting how they interact with energy or fields. In organic chemistry, instruments are often faster, more sensitive and need much smaller samples than older chemical tests.
A spectrum is a graph showing signal intensity against another quantity, such as m/z, wavenumber or chemical shift. Modern instruments usually record these digitally, so spectra can be compared with databases. For example, some breathalysers use IR absorption by ethanol and compare the signal with calibration data.
Instrumental analysis
Instrumental analysis is the use of instruments to obtain data about a substance, often as a spectrum, so that its identity, structure or concentration can be determined.
No single spectrum tells you everything
Mass spectrometry, IR and NMR answer different questions. The strongest structural conclusions come from using all the evidence together.
Mass spectrometry: weighing ions
Mass spectrometry separates positive ions according to their mass-to-charge ratio, written as m/z. For most simple A-Level organic spectra, ions have a charge of +1, so m/z is numerically the relative mass of the ion.
A typical process is:
- The sample is vaporised.
- Molecules are ionised, often by knocking off an electron:
- Positive ions are accelerated and separated according to m/z.
- A detector records the abundance of each ion.
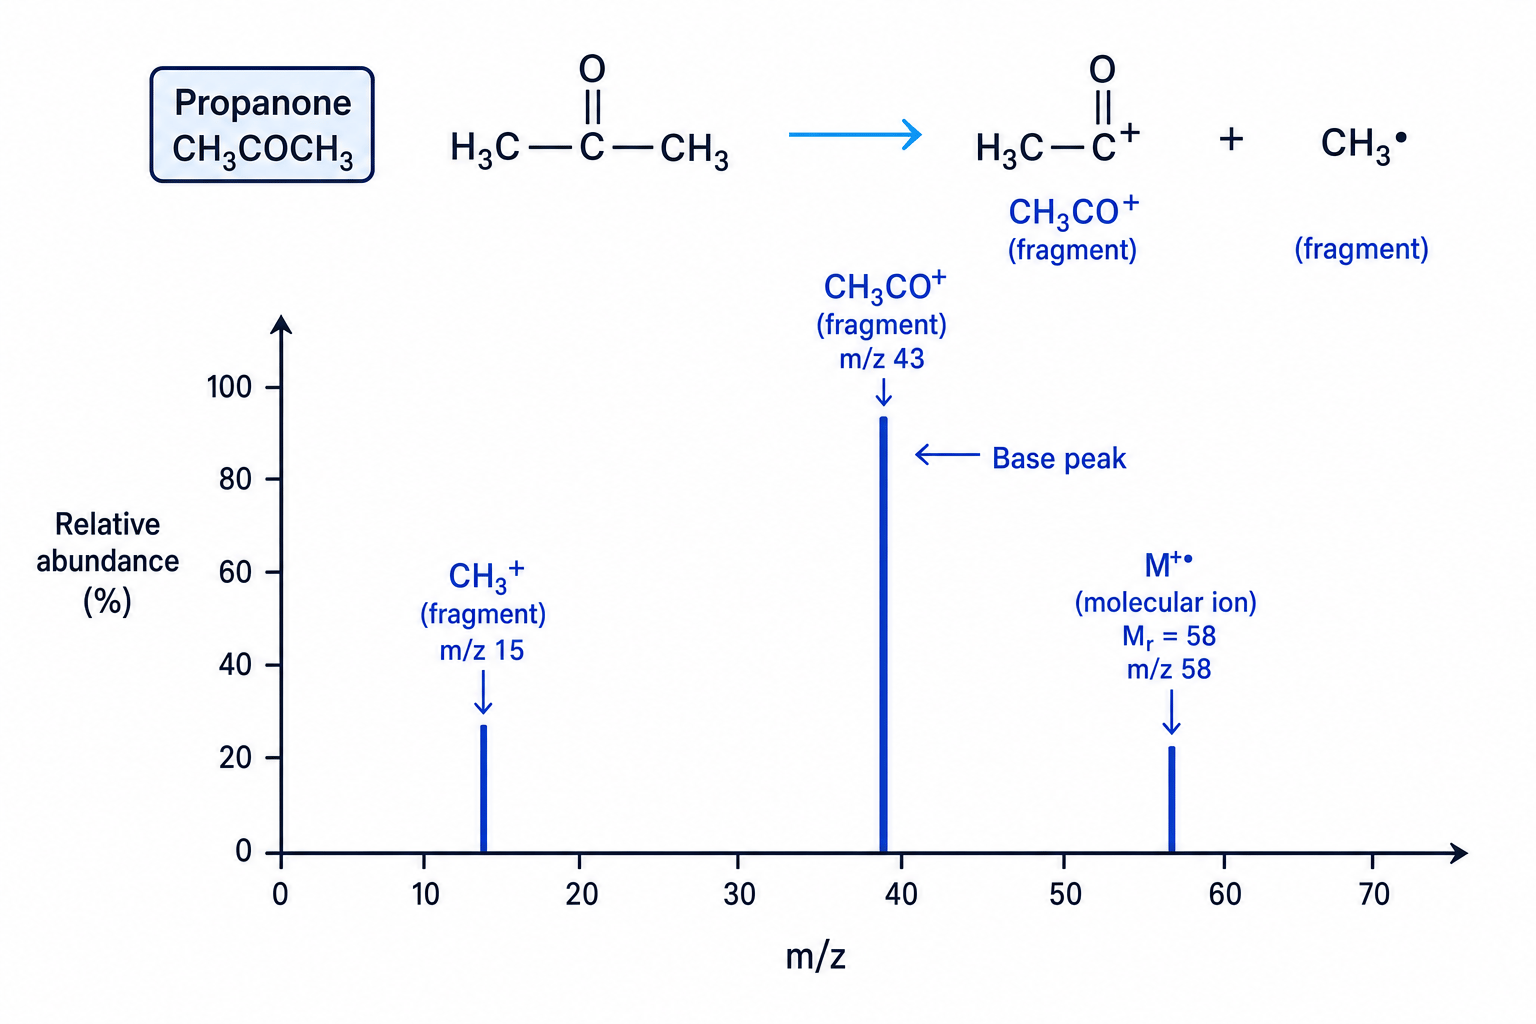
The molecular ion peak is caused by the whole molecule after losing one electron, M⁺·. It gives the relative molecular mass, MrM_rMr, if the ion has charge +1.
The base peak is the tallest peak in the spectrum. Its relative abundance is set to 100%. It is the most abundant ion, but it is not necessarily the molecular ion.
Fragment ions form when the molecular ion breaks apart. These fragments help you infer parts of the molecule.
Small isotope peaks may also appear. For example, an M+1 peak can be caused by ¹³C, and M+2 peaks are especially useful for spotting chlorine or bromine patterns.
Interpreting a simple mass spectrum
A compound gives a molecular ion peak at m/z 58 and a base peak at m/z 43. A possible formula is C₃H₆O. Explain how this supports propanone.
-
Use the molecular ion peak: for a +1 ion, m/z 58 means Mr=58M_r = 58Mr=58. For C₃H₆O, Mr=3×12.0+6×1.0+16.0=58.0M_r = 3 \times 12.0 + 6 \times 1.0 + 16.0 = 58.0Mr=3×12.0+6×1.0+16.0=58.0, so the formula fits.
-
Interpret the base peak: m/z 43 can be CH₃CO⁺, because 12.0+3×1.0+12.0+16.0=43.012.0 + 3 \times 1.0 + 12.0 + 16.0 = 43.012.0+3×1.0+12.0+16.0=43.0.
-
Connect the fragment to the structure: propanone, CH₃COCH₃, can fragment to give CH₃CO⁺ and CH₃·. The data therefore support propanone, although IR or NMR would be used to confirm it.
Base peak vs molecular ion
Do not assume the tallest peak gives MrM_rMr. The molecular ion is the peak for the whole molecule; the base peak is just the most abundant ion.
IR spectroscopy: identifying bonds
Infrared spectroscopy, or IR spectroscopy, measures which infrared frequencies are absorbed by bonds in a molecule. Bonds absorb IR radiation when the energy matches a bond vibration.
IR spectra normally plot transmittance against wavenumber. A low transmittance dip means strong absorption. Wavenumber has units cm⁻¹ and the axis usually decreases from left to right.
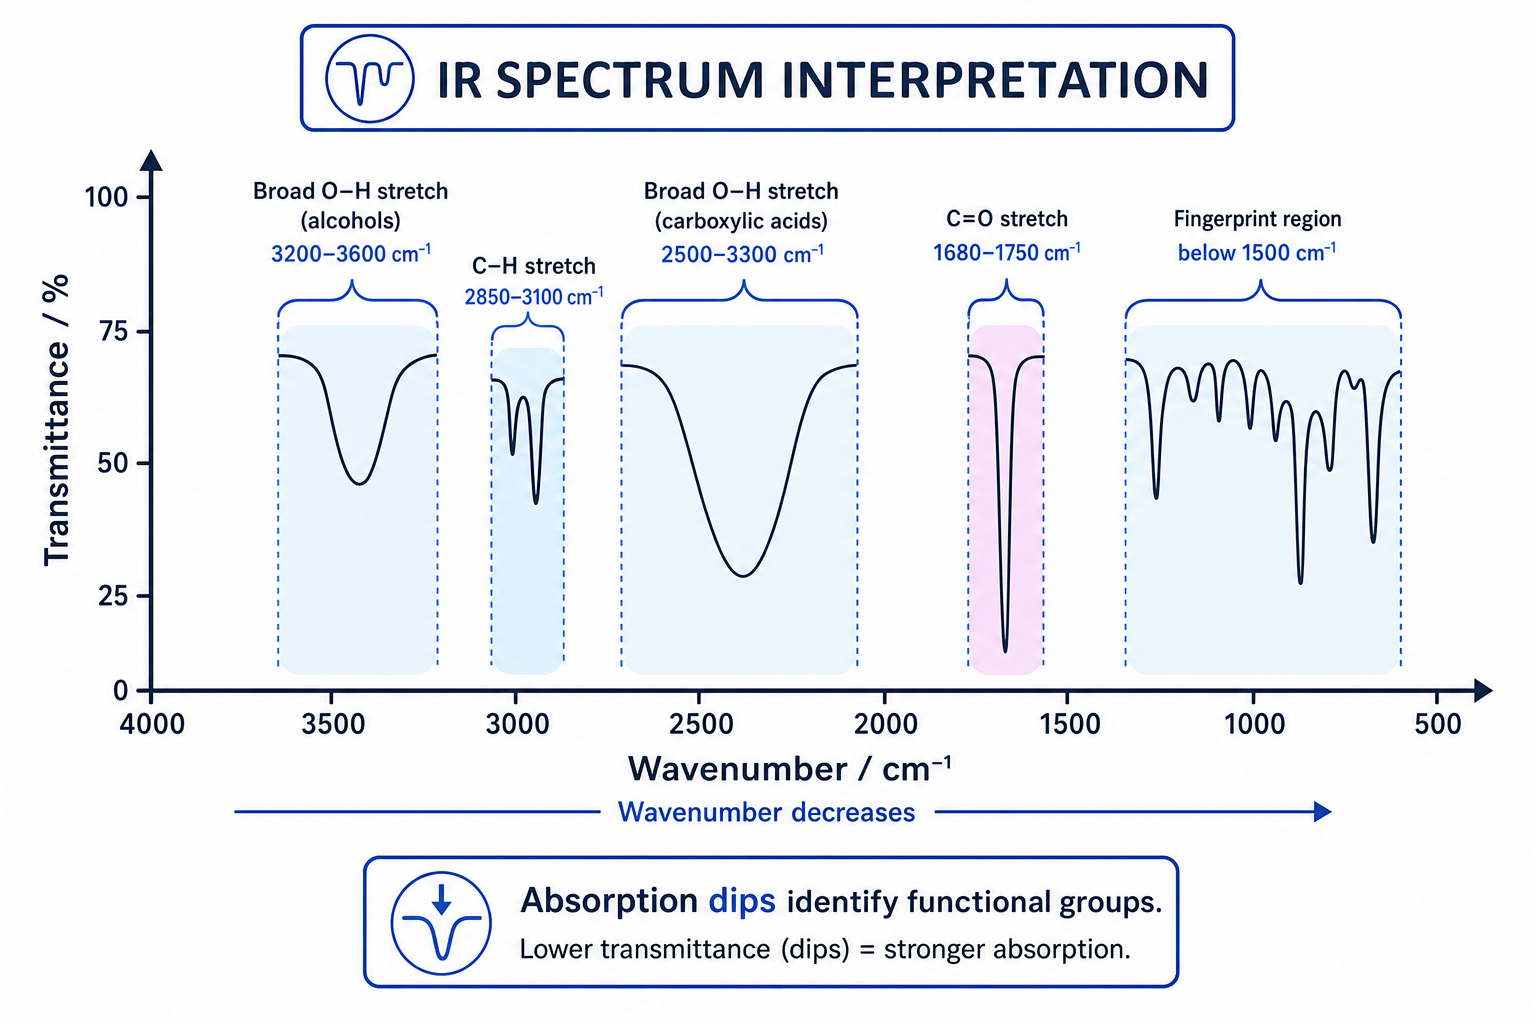
Common useful absorptions:
| Bond or region | Typical absorption | What it suggests |
|---|---|---|
| O-H in alcohols | broad 3200–3600 cm⁻¹ | alcohol or phenol |
| O-H in carboxylic acids | very broad 2500–3300 cm⁻¹ | carboxylic acid |
| C=O | strong 1680–1750 cm⁻¹ | carbonyl compound |
| C-H | 2850–3100 cm⁻¹ | organic C-H bonds |
| Fingerprint region | below 1500 cm⁻¹ | comparison with known spectra |
The fingerprint region is complex but highly characteristic. It is often used to confirm identity by comparison with a reference spectrum.
Identifying a carboxylic acid from IR
An IR spectrum has a strong absorption at 1710 cm⁻¹ and a very broad absorption from about 2500–3300 cm⁻¹. What functional group is strongly indicated?
-
The strong absorption at 1710 cm⁻¹ indicates a C=O bond, so the compound contains a carbonyl group.
-
The very broad 2500–3300 cm⁻¹ absorption matches the O-H stretch of a carboxylic acid, not the narrower alcohol O-H region.
-
Combining C=O and acid O-H gives the carboxylic acid group, –COOH.
IR is best for functional groups
Use IR to say what functional groups are present or absent. It usually does not give the full carbon skeleton on its own.
NMR spectroscopy: chemical environments
Nuclear magnetic resonance spectroscopy, or NMR spectroscopy, studies nuclei such as ¹H and ¹³C in a magnetic field. Nuclei in different chemical surroundings absorb at different positions.
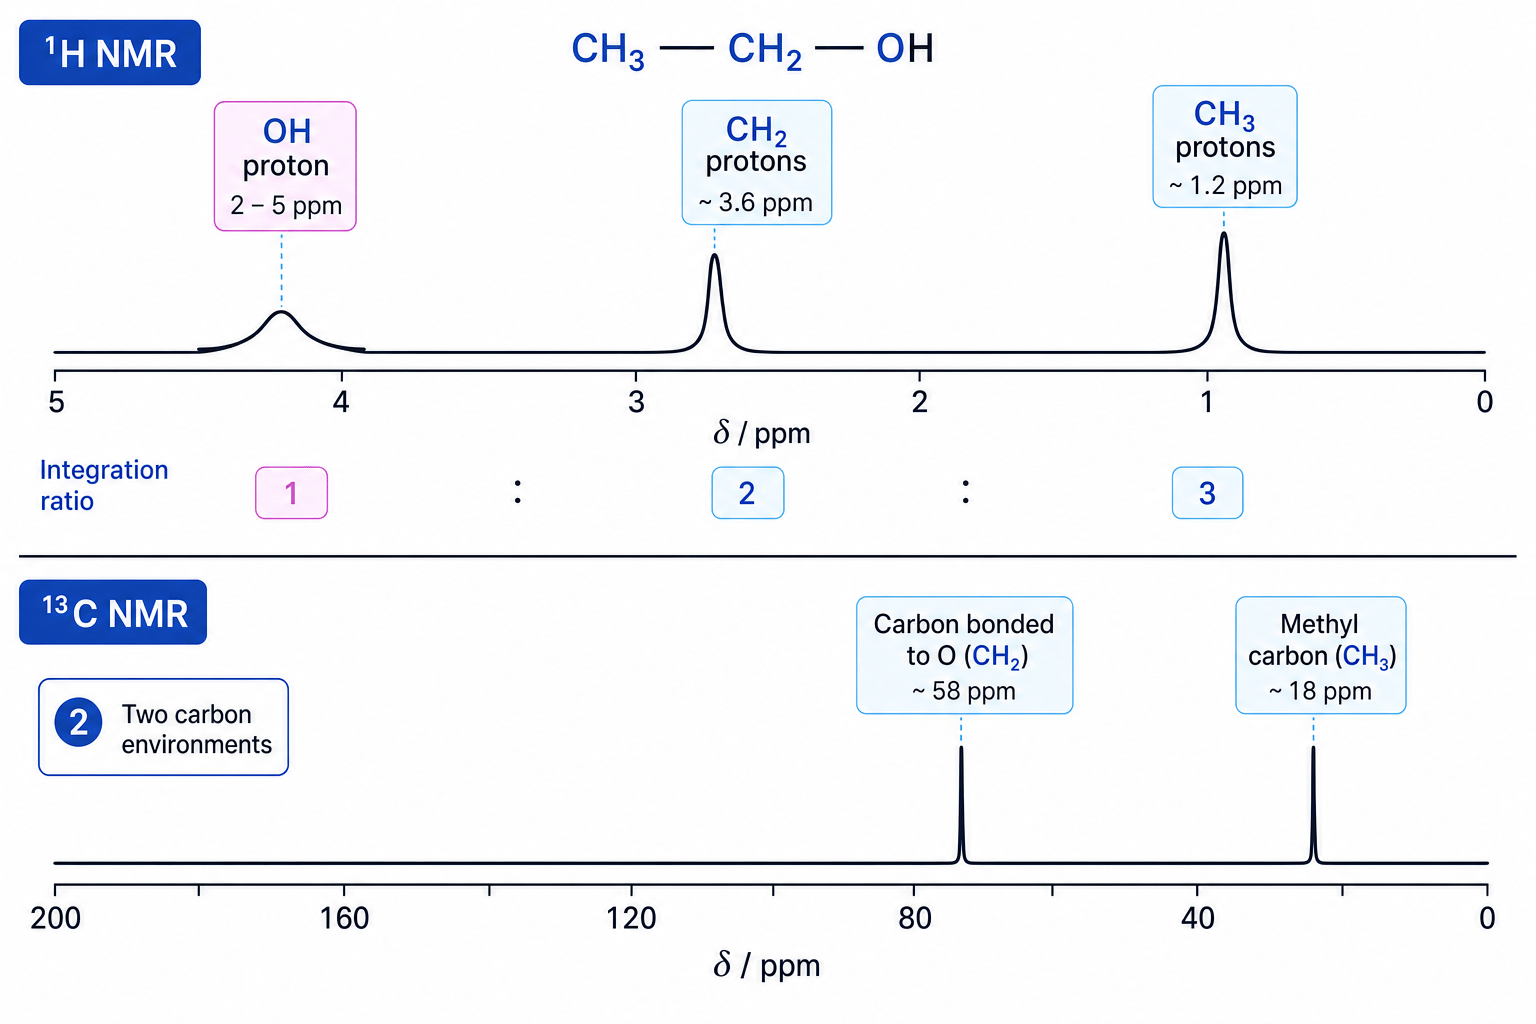
A chemical environment is a unique electronic and structural surroundings for a nucleus. Nuclei in the same environment give one NMR signal.
The signal position is the chemical shift, δ\deltaδ, measured in ppm relative to TMS, tetramethylsilane. Signals further left have higher δ\deltaδ values and often indicate nuclei near electronegative atoms or π bonds.
¹³C NMR
In ¹³C NMR, the number of signals tells you the number of different carbon environments.
Useful ¹³C shift regions:
| Carbon environment | Typical chemical shift |
|---|---|
| Alkyl C-C carbons | 0–50 ppm |
| Carbon bonded to O, N or halogen | 50–90 ppm |
| C=C or aromatic carbons | 100–150 ppm |
| Ester, acid or amide C=O | 160–185 ppm |
| Aldehyde or ketone C=O | 190–220 ppm |
Do not integrate ¹³C peaks
In ordinary ¹³C NMR, peak heights are not reliable measures of how many carbons are present. Count the number of signals, not their heights.
Low-resolution ¹H NMR
In low-resolution ¹H NMR, each proton environment appears as one signal. You use:
- Number of signals: number of different proton environments.
- Integration: area under each signal, proportional to the number of protons in that environment.
- Chemical shift: clues about nearby atoms or functional groups.
Useful ¹H shift clues include alkyl protons at about 0.5–2 ppm, protons next to C=O at about 2–3 ppm, protons next to O or halogen at about 3–4.5 ppm, alkene or aromatic protons at about 5–8 ppm, and aldehyde protons at about 9–10 ppm.
Low resolution means no splitting
In low-resolution ¹H NMR, you do not use spin-spin splitting patterns. If an exam question specifies low resolution, focus on number of signals, integration and chemical shift.
Combining mass, IR and NMR data
An unknown compound has molecular ion peak m/z 88. Its IR spectrum has a strong absorption at 1740 cm⁻¹ and no broad O-H absorption. Its ¹³C NMR has four signals at 14, 21, 60 and 171 ppm. Its low-resolution ¹H NMR has signals with areas 12, 8 and 12 at 1.3, 4.1 and 2.1 ppm. Deduce the structure.
-
Simplify the ¹H integration: 12:8:1212:8:1212:8:12 divides by 4 to give 3:2:33:2:33:2:3, so there are two CH₃-type environments and one CH₂-type environment.
-
Use the IR data: the strong 1740 cm⁻¹ absorption shows C=O, and the absence of broad O-H rules out alcohols and carboxylic acids. A carbonyl compound such as an ester is likely.
-
Use the ¹³C NMR: the 171 ppm signal fits an ester C=O, and the 60 ppm signal fits a carbon bonded to oxygen. Four ¹³C signals mean four different carbon environments.
-
Match the ¹H shifts: 4.1 ppm with integration 2 suggests –OCH₂–; 2.1 ppm with integration 3 suggests CH₃CO–; 1.3 ppm with integration 3 suggests a terminal CH₃.
-
Assemble and check the structure: CH₃COOCH₂CH₃ is ethyl ethanoate. Its formula is C₄H₈O₂, and 4×12.0+8×1.0+2×16.0=88.04 \times 12.0 + 8 \times 1.0 + 2 \times 16.0 = 88.04×12.0+8×1.0+2×16.0=88.0, matching the molecular ion.
A good structure-deduction workflow
When you are given several spectra, work systematically:
- Find the molecular ion in the mass spectrum to get MrM_rMr.
- Use IR to identify key functional groups, especially O-H and C=O.
- Count ¹³C signals to find carbon environments.
- Use low-resolution ¹H NMR signals, integrations and shifts to build fragments.
- Propose a structure and check that every spectrum agrees.
In the exam
-
Read peak positions carefully from the axes before interpreting: m/z for mass spectra, cm⁻¹ for IR, and ppm for NMR.
-
Always combine positive and negative evidence: for example, a C=O absorption plus no broad O-H can rule out a carboxylic acid.
-
After proposing a structure, check MrM_rMr, functional groups, number of carbon environments, number of proton environments and integration ratio.
Check yourself
- What is the difference between the molecular ion peak and the base peak in a mass spectrum?
- How would you distinguish an alcohol from a carboxylic acid using IR spectroscopy?
- In low-resolution ¹H NMR, what information comes from the number of signals and the integration ratio?
