

What you'll learn
- What rate of reaction means and how its units are worked out.
- How to calculate average, instantaneous and initial rates from data and graphs.
- How common rate experiments are set up, including gas collection, mass loss, colour change and clock reactions.
- How to improve reliability, control variables and avoid common graph-reading mistakes.
The basic idea: how fast is a reaction?
Some reactions are very fast, such as precipitation reactions. Others are slow, such as rusting. In kinetics, we describe this using the rate of reaction.
Reaction rate
The rate of reaction is the change in amount, concentration, mass or volume of a reactant or product per unit time. At A-Level, the most common definition is:
rate=change in concentrationtime taken\text{rate} = \frac{\text{change in concentration}}{\text{time taken}}rate=time takenchange in concentrationThe usual units are mol dm⁻³ s⁻¹.
For a reactant, concentration decreases during the reaction. For a product, concentration increases. To keep rate positive, we often write:
rate of disappearance of A=−Δ[A]Δt\text{rate of disappearance of A} = -\frac{\Delta[A]}{\Delta t}rate of disappearance of A=−ΔtΔ[A]The minus sign is there because Δ[A]\Delta[A]Δ[A] is negative for a reactant.
Average rate from data
An average rate is the rate over a chosen time interval. It does not tell you the exact rate at every moment; it gives the overall change divided by the time taken.
Average rate
The average rate over a time interval is calculated using the change between two measured values:
average rate=ΔconcentrationΔt\text{average rate} = \frac{\Delta \text{concentration}}{\Delta t}average rate=ΔtΔconcentrationFor a reactant, use a minus sign if you want the rate to be positive.
Calculating average rate
Hydrogen peroxide decomposes:
2H₂O₂(aq) → 2H₂O(l) + O₂(g)
In an experiment, the concentration of H₂O₂ falls from 0.800 mol dm⁻³ to 0.560 mol dm⁻³ in 120 s. Calculate the average rate of disappearance of H₂O₂.
-
Find the change in concentration of H₂O₂:
Δ[H2O2]=0.560−0.800=−0.240 mol dm−3\Delta[\text{H}_2\text{O}_2] = 0.560 - 0.800 = -0.240\ \text{mol dm}^{-3}Δ[H2O2]=0.560−0.800=−0.240 mol dm−3 -
Use the rate expression for a reactant:
rate=−Δ[H2O2]Δt\text{rate} = -\frac{\Delta[\text{H}_2\text{O}_2]}{\Delta t}rate=−ΔtΔ[H2O2] -
Substitute the values:
rate=−−0.240120=2.00×10⁻³ mol dm−3 s−1\text{rate} = -\frac{-0.240}{120} = 2.00 \times 10^{-3}\ \text{mol dm}^{-3}\,\text{s}^{-1}rate=−120−0.240=2.00×10⁻³ mol dm−3s−1
Rate graphs: gradients matter
Rates are often found from graphs. The key skill is understanding that rate is a gradient.
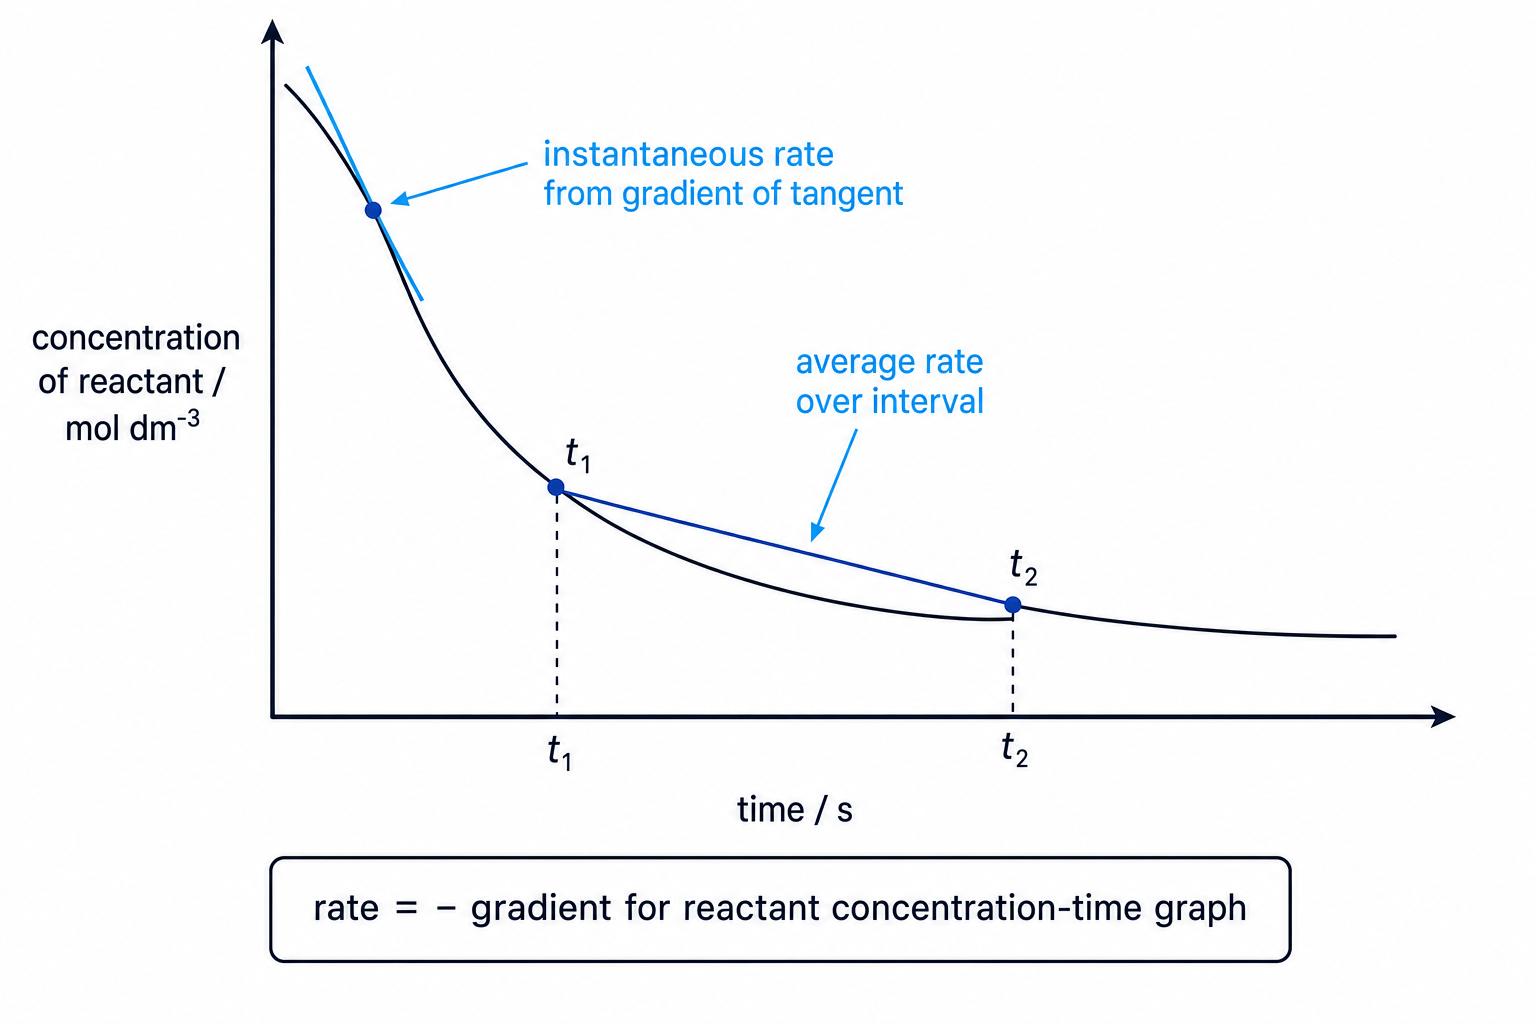
If the graph shows concentration of a reactant against time, the curve slopes downwards. Its gradient is negative, so the reaction rate is the negative of the gradient. If the graph shows amount, concentration or volume of a product against time, the curve slopes upwards, so the gradient is positive.
Rate from a graph
On a concentration-time graph, the rate at a particular time is found from the gradient of the tangent at that time. The average rate over an interval is found from the gradient of the chord joining two points.
Instantaneous rate
An instantaneous rate is the rate at one specific moment. You estimate it by drawing a tangent to the curve at that time, then calculating the gradient of the tangent.
Finding instantaneous rate from a tangent
A tangent is drawn to a reactant concentration-time curve. Two convenient points on the tangent are:
- 30 s, 0.162 mol dm⁻³
- 90 s, 0.096 mol dm⁻³
Calculate the instantaneous rate of disappearance of the reactant.
-
Calculate the gradient of the tangent:
gradient=0.096−0.16290−30\text{gradient} = \frac{0.096 - 0.162}{90 - 30}gradient=90−300.096−0.162 -
Evaluate the gradient:
gradient=−0.06660=−1.10×10⁻³ mol dm−3 s−1\text{gradient} = \frac{-0.066}{60} = -1.10 \times 10^{-3}\ \text{mol dm}^{-3}\,\text{s}^{-1}gradient=60−0.066=−1.10×10⁻³ mol dm−3s−1 -
Convert the negative gradient into a positive rate of disappearance:
rate=1.10×10⁻³ mol dm−3 s−1\text{rate} = 1.10 \times 10^{-3}\ \text{mol dm}^{-3}\,\text{s}^{-1}rate=1.10×10⁻³ mol dm−3s−1
Forgetting the sign on reactant graphs
A reactant concentration-time graph has a negative gradient. The rate of disappearance is positive, so use the magnitude of the gradient or include the minus sign in −Δ[A]/Δt-\Delta[A]/\Delta t−Δ[A]/Δt.
Why the rate changes during a reaction
For many reactions, the graph is steep at the start and then becomes less steep. This means the reaction is fastest at the beginning.
As the reaction proceeds, reactant concentrations decrease. There are fewer reacting particles per unit volume, so successful collisions happen less often. Eventually, for a reaction that goes effectively to completion, the graph levels off when the limiting reactant has been used up.
Common ways to measure rate
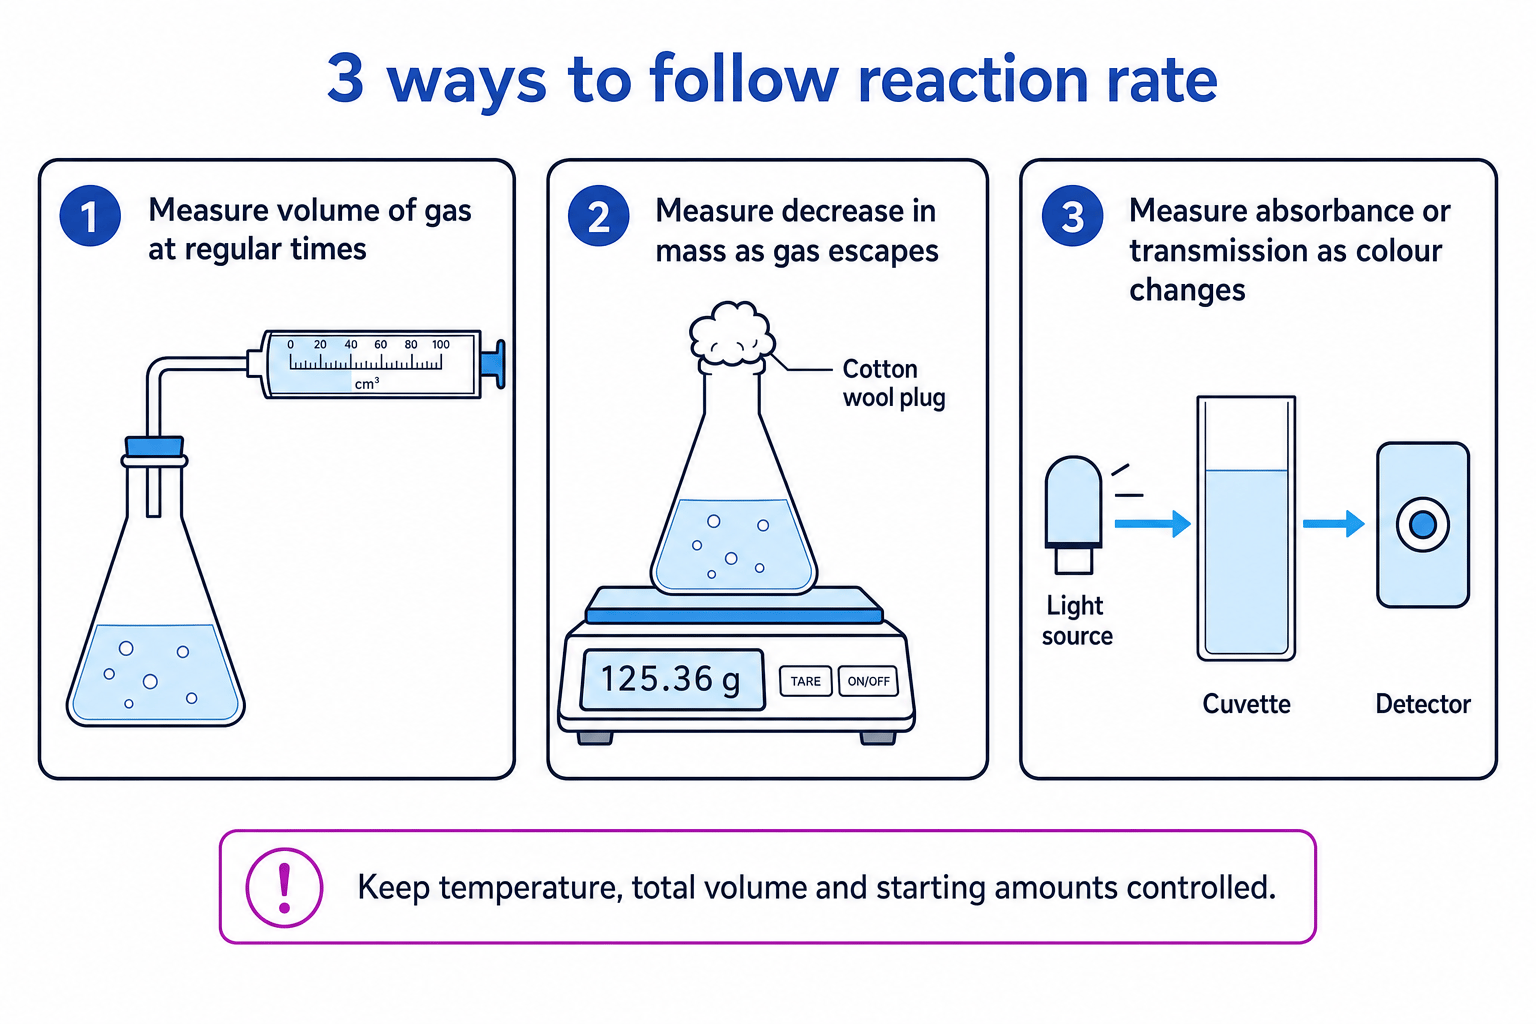
In a rate experiment, you follow a measurable change with time. The best method depends on what changes during the reaction.
Gas volume
Use a gas syringe when a gas is produced. For example:
CaCO₃(s) + 2HCl(aq) → CaCl₂(aq) + H₂O(l) + CO₂(g)
You record the volume of CO₂ at regular time intervals. A volume-time graph can then be used to find rates in cm³ s⁻¹, or converted to amount if needed.
Mass loss
If a gas escapes from the reaction vessel, the mass decreases. Place the flask on a balance and record mass at regular intervals. A cotton wool plug can stop liquid spray escaping while still allowing gas to leave.
This method is useful when gas collection is awkward, but it is less suitable if the mass change is very small compared with the total mass.
Colour change and colorimetry
If a coloured reactant or product changes concentration, a colorimeter can measure absorbance or transmission over time. This is more objective than judging colour by eye.
A calibration curve may be needed if you want to convert absorbance into concentration.
Precipitation and clock reactions
Some reactions form a precipitate, making the mixture cloudy. A classic example is sodium thiosulfate with hydrochloric acid:
Na₂S₂O₃(aq) + 2HCl(aq) → 2NaCl(aq) + SO₂(g) + S(s) + H₂O(l)
The sulfur precipitate makes the mixture cloudy, so a cross underneath the flask eventually disappears.
Clock reaction
A clock reaction measures the time taken to reach a fixed visible endpoint, such as a colour appearing or a cross disappearing. If the same endpoint is used each time, the initial rate is often taken as proportional to 1/t1/t1/t.
Using 1/t
For clock reactions with the same endpoint, a shorter time means a faster reaction. Comparing 1/t1/t1/t values lets you compare relative rates without knowing the exact concentration change.
Comparing rates in a clock reaction
In a sodium thiosulfate experiment, the same cross disappears after 80 s in experiment A and after 40 s in experiment B. Compare the approximate initial rates.
-
Because the endpoint is the same, compare rates using 1/t1/t1/t.
-
Find the rate ratio:
rate Brate A=1/401/80\frac{\text{rate B}}{\text{rate A}} = \frac{1/40}{1/80}rate Arate B=1/801/40 -
Simplify the ratio:
rate Brate A=8040=2\frac{\text{rate B}}{\text{rate A}} = \frac{80}{40} = 2rate Arate B=4080=2
So experiment B is approximately twice as fast as experiment A.
Clock reactions are approximate
The 1/t1/t1/t method only compares rates fairly if the endpoint represents the same amount of product each time and all other conditions are controlled.
Planning a fair rate experiment
A good rate experiment changes one variable and keeps the others constant.
The independent variable is the factor you choose to change, such as concentration, temperature or surface area. The dependent variable is what you measure, such as volume of gas or time for a colour change. Control variables are the factors kept the same to make the comparison fair.
Choosing a method for calcium carbonate and hydrochloric acid
You want to investigate how changing acid concentration affects the rate of reaction between calcium carbonate and hydrochloric acid.
-
Identify a measurable change: CO₂ gas is produced, so gas volume or mass loss can be followed over time.
-
Choose suitable equipment: a gas syringe gives a direct volume-time graph for CO₂, so it is a good choice if the apparatus is gas-tight.
-
Decide what to control: keep the mass of CaCO₃, chip size or surface area, total volume of solution and temperature constant.
-
Decide how to process the data: plot volume of CO₂ against time, then compare initial gradients for different acid concentrations.
Improving reliability and accuracy
Repeat experiments and calculate a mean, but only after checking for anomalous results. Use a water bath if temperature must be controlled. Start timing as soon as reactants are mixed, and use the same method of mixing each time.
For graphs, take readings at shorter time intervals near the start because the rate changes fastest there. Later on, readings can be more spread out because the curve becomes flatter.
Sanity check for rate graphs
A product graph usually starts at zero and levels off. A reactant graph starts high and falls, then levels off. In both cases, the curve is normally steepest at the start.
In the exam
-
Check what the graph is showing: reactant concentration, product concentration, gas volume, mass, pH or another measured quantity.
-
For a rate at a time, draw or use a tangent; for an average rate, use two points on the curve and calculate a chord gradient.
-
Always include units, and remember that reactant gradients are negative but rates are normally reported as positive values.
Check yourself
- Why does a reactant concentration-time graph usually become less steep as the reaction proceeds?
- How would you find an instantaneous rate from a graph?
- In a clock reaction, why can 1/t1/t1/t be used to compare rates only when the endpoint is the same?
