What you'll learn
- Why covalent bonds absorb infrared radiation.
- How to read an infrared spectrum using wavenumbers.
- How characteristic absorptions identify functional groups.
- How infrared spectroscopy links to greenhouse gases and organic analysis.
The basic idea: bonds can vibrate
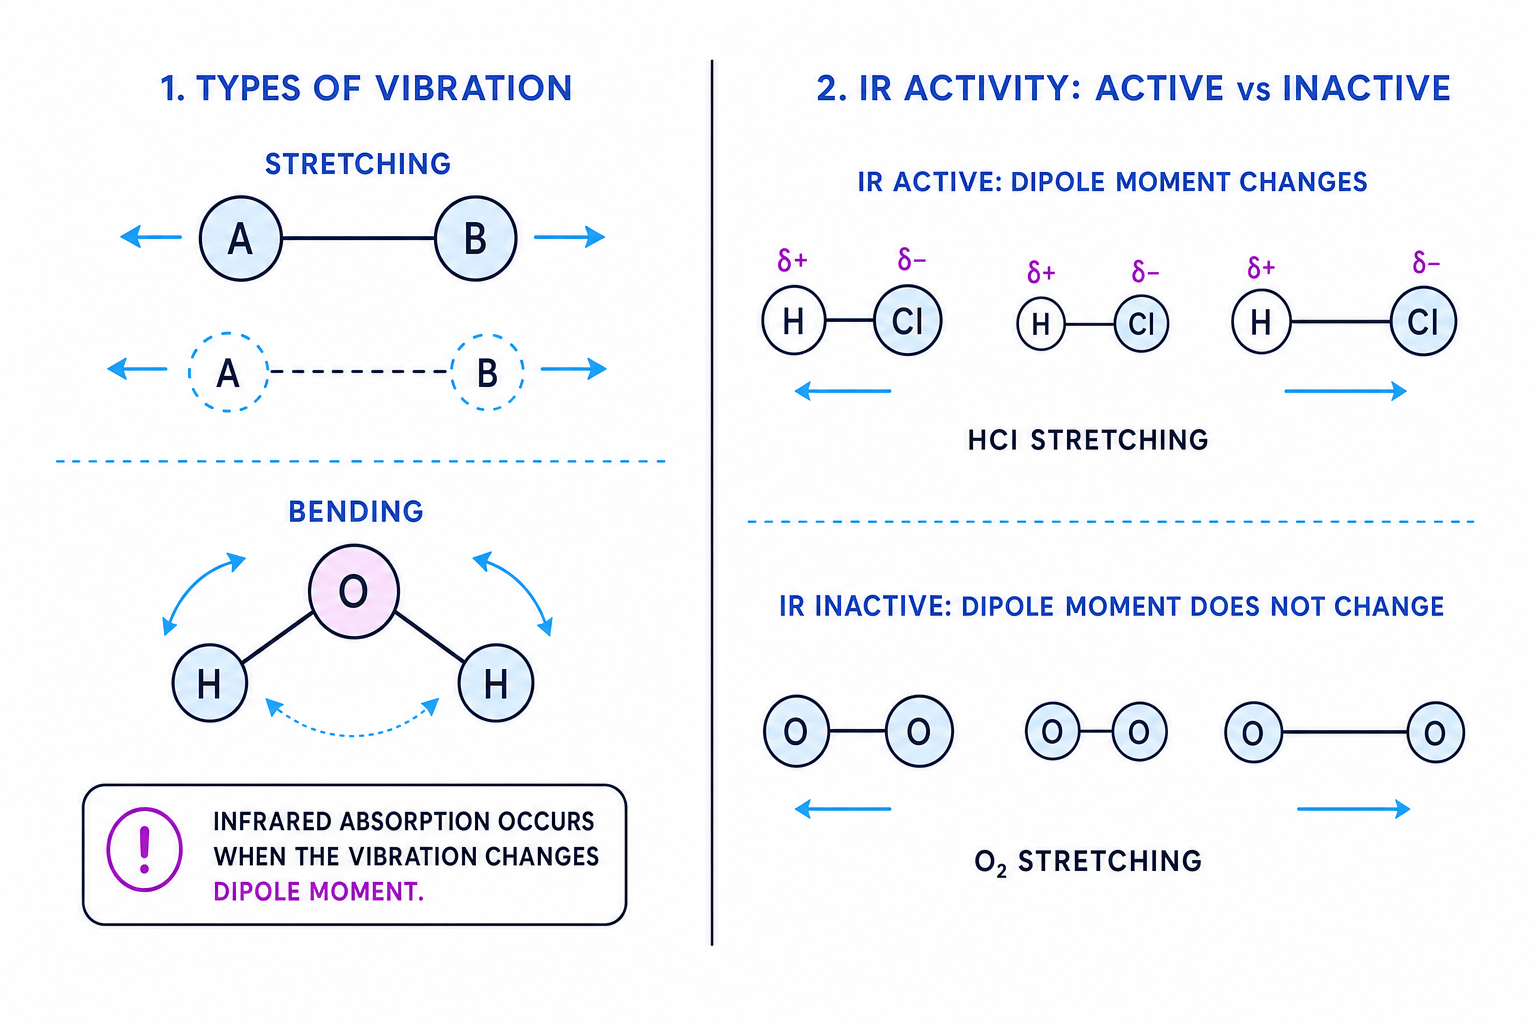
Molecules are not rigid. In a covalent molecule, atoms joined by bonds are always vibrating. Bonds can stretch as atoms move closer together and further apart, or bend as bond angles change.
Infrared radiation has the right energy range to increase the vibrational energy of many covalent bonds.
Infrared spectroscopy
Infrared spectroscopy is an analytical technique that measures which frequencies of infrared radiation are absorbed by a substance. The absorptions give information about the covalent bonds and functional groups present.
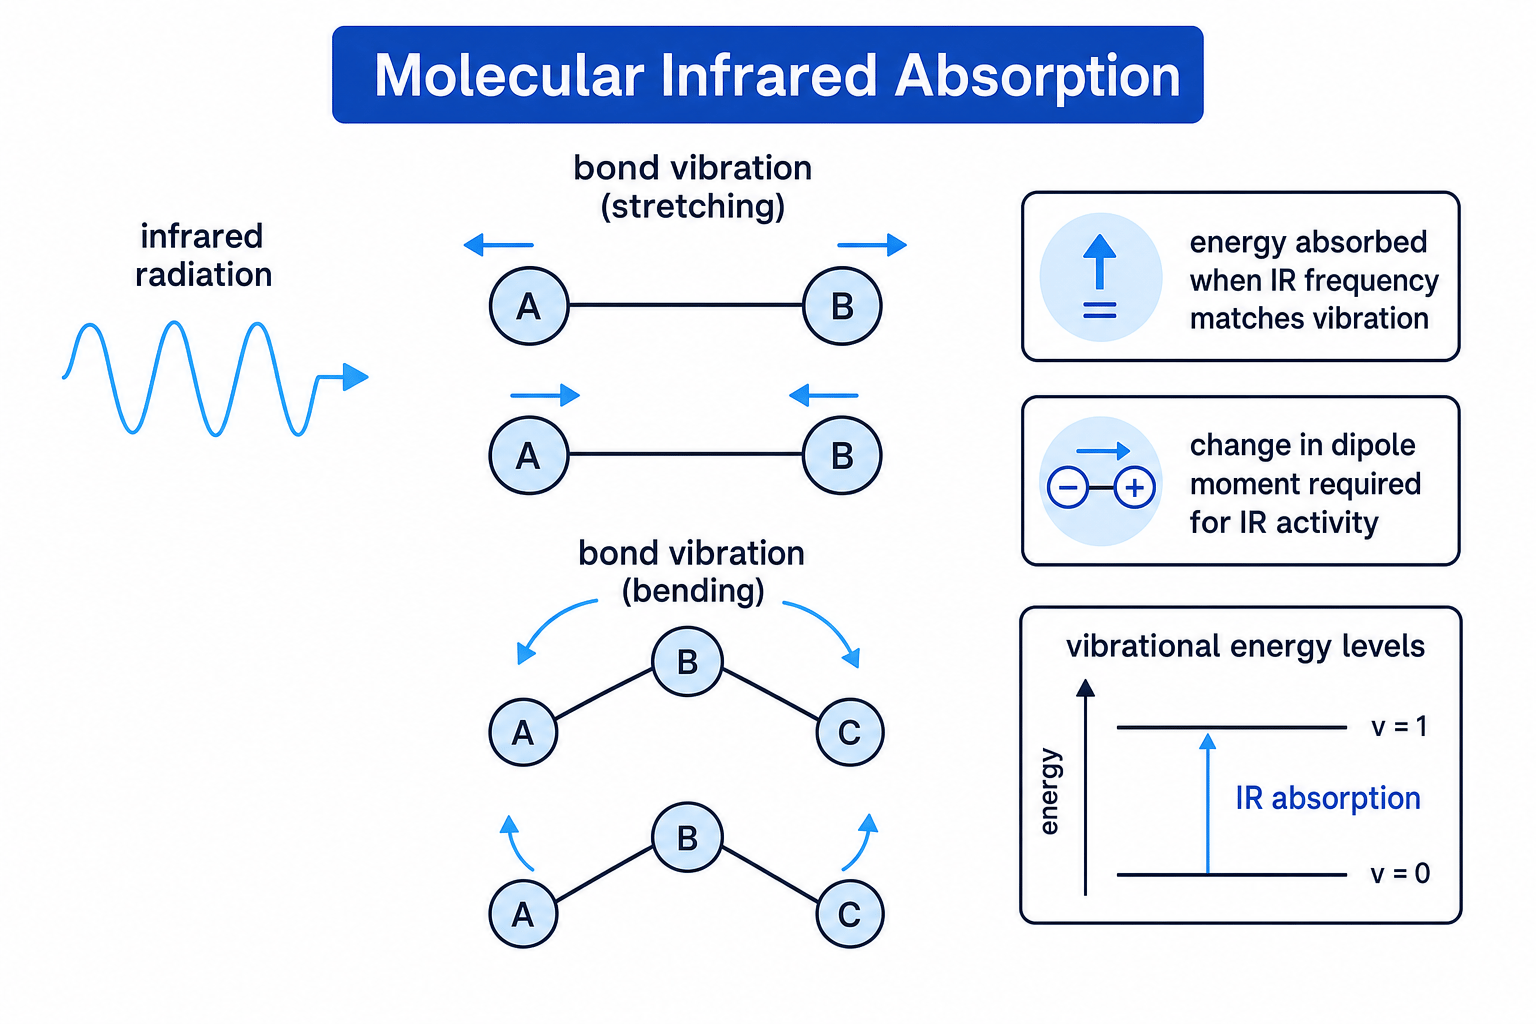
A bond absorbs infrared radiation when the radiation frequency matches one of the bond’s allowed vibrational frequencies. For a vibration to be detected in an IR spectrum, it must cause a change in the molecule’s dipole moment, meaning the separation of partial positive and partial negative charge changes during the vibration.
Why IR absorption happens
Infrared radiation is absorbed when its energy matches the energy gap between vibrational energy levels in a covalent bond.
Energy, frequency and wavenumber
Electromagnetic radiation can be described using frequency, wavelength and energy.
Frequency and wavelength
Frequency, ν\nuν, is the number of wave cycles passing a point per second, measured in Hz. Wavelength, λ\lambdaλ, is the distance between equivalent points on adjacent waves, measured in m.
The energy of radiation is given by:
E=hνE = h\nuE=hνwhere hhh is the Planck constant and ν\nuν is frequency.
Frequency and wavelength are related by:
ν=cλ\nu = \frac{c}{\lambda}ν=λcwhere ccc is the speed of light.
In infrared spectroscopy, the x-axis is usually wavenumber, not wavelength.
Wavenumber
Wavenumber, ν~\tilde{\nu}ν~, is the reciprocal of wavelength. In IR spectroscopy it is usually measured in cm⁻¹.
where λ\lambdaλ must be in cm if the wavenumber is required in cm⁻¹.
Higher wavenumber means higher frequency and higher energy. In general, stronger bonds and bonds involving lighter atoms absorb at higher wavenumber.
Converting wavelength to wavenumber
An absorption occurs at a wavelength of 5.80 μm. Find the wavenumber and suggest the type of bond likely to absorb here.
-
Convert the wavelength into cm, because IR wavenumber is normally given in cm⁻¹:
5.80 μm=5.80×10⁻⁴ cm5.80\ \mu\text{m} = 5.80 \times 10^{-4}\ \text{cm}5.80 μm=5.80×10⁻⁴ cm -
Use the reciprocal relationship:
ν~=15.80×10⁻⁴ cm=1.72×103 cm−1\tilde{\nu} = \frac{1}{5.80 \times 10^{-4}\ \text{cm}} = 1.72 \times 10^3\ \text{cm}^{-1}ν~=5.80×10⁻⁴ cm1=1.72×103 cm−1 -
Compare 1720 cm⁻¹ with IR data. This lies in the carbonyl C=O region, so the absorption suggests a C=O bond.
What an IR spectrum shows
An IR spectrum is usually plotted as:
- y-axis: transmittance / %
- x-axis: wavenumber / cm⁻¹
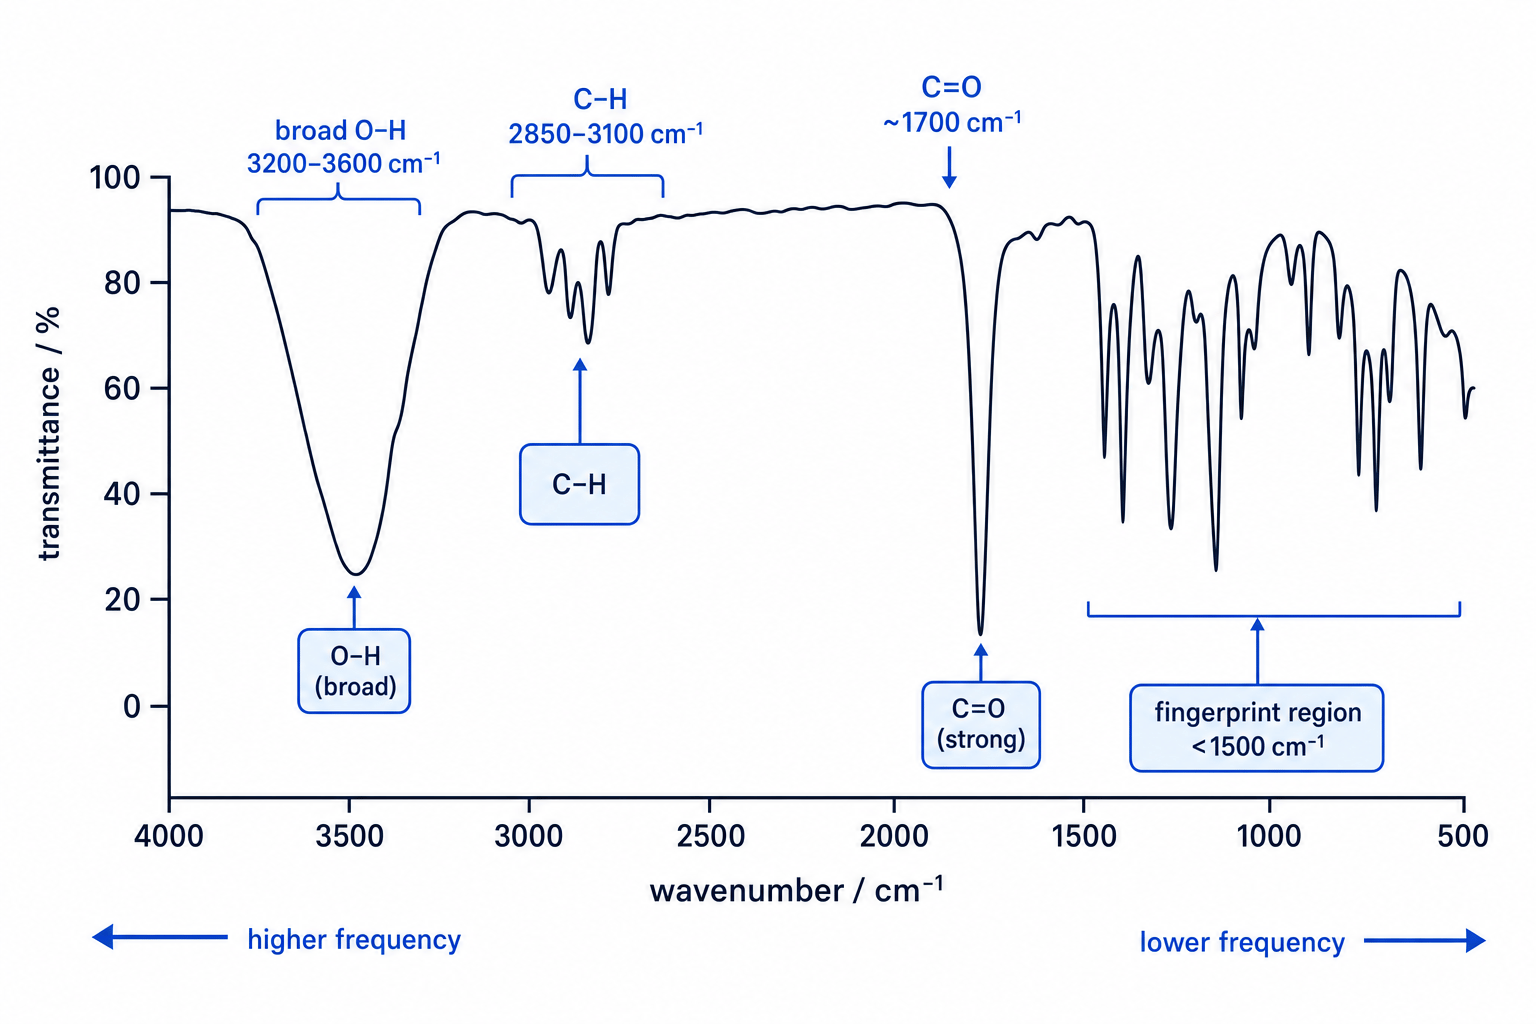
Transmittance is the percentage of infrared radiation that passes through the sample. If a bond absorbs strongly at a particular wavenumber, less radiation gets through, so the spectrum shows a downward peak.
Reading the x-axis backwards
Most IR spectra have wavenumber decreasing from left to right: about 4000 cm⁻¹ on the left down to about 500 cm⁻¹ on the right. Do not treat the right-hand side as “higher energy”.
The region above about 1500 cm⁻¹ is often called the functional group region. The region below about 1500 cm⁻¹ is the fingerprint region.
Characteristic absorptions
Different bonds absorb at different wavenumber ranges. You are not expected to memorise every value perfectly; in exams you are usually given a data table. However, you should recognise the most important patterns.
| Bond or group | Typical absorption / cm⁻¹ | Useful clue |
|---|---|---|
| O-H in alcohols | 3230–3550 | Broad absorption |
| O-H in carboxylic acids | 2500–3300 | Very broad, often overlaps C-H |
| N-H in amines or amides | 3300–3500 | Often sharper than O-H |
| C-H in alkanes | 2850–2960 | Common in organic molecules |
| C=O in carbonyl compounds | 1680–1750 | Strong, sharp absorption |
| C=C in alkenes | 1620–1680 | Often weaker than C=O |
| C≡N in nitriles | 2210–2260 | Sharp absorption |
| C-O in alcohols, esters, acids | 1000–1300 | Often in fingerprint region |
High-value peaks
The two most useful A-Level IR clues are often a broad O-H absorption and a strong C=O absorption. Together, they can narrow down a functional group very quickly.
Using IR to identify functional groups
Infrared spectroscopy rarely gives the whole structure by itself. Instead, it tells you which functional groups are likely to be present or absent.
For example:
- A broad absorption around 3230–3550 cm⁻¹ suggests an alcohol O-H group.
- A strong absorption around 1700 cm⁻¹ suggests a carbonyl C=O group.
- A very broad absorption around 2500–3300 cm⁻¹ together with a C=O absorption suggests a carboxylic acid.
Identifying an unknown functional group
An organic compound has a very broad absorption from 2500–3300 cm⁻¹ and a strong absorption at 1710 cm⁻¹. Suggest the functional group present.
-
The strong absorption at 1710 cm⁻¹ matches the C=O region, so the molecule contains a carbonyl group.
-
The very broad absorption from 2500–3300 cm⁻¹ is characteristic of the O-H bond in a carboxylic acid, not a normal alcohol O-H.
-
Combining the C=O and acid O-H evidence suggests the functional group is carboxylic acid, -COOH.
Using one peak alone
Do not identify a whole molecule from a single absorption. A C=O peak tells you there is a carbonyl group, but you need other evidence to distinguish aldehydes, ketones, carboxylic acids and esters.
The fingerprint region
The fingerprint region is the complex region below about 1500 cm⁻¹. It contains many absorptions caused by bending vibrations and single-bond stretching vibrations.
It is usually difficult to assign every peak in this region. Instead, chemists compare the whole pattern with a database of known spectra.
Fingerprint region
The fingerprint region is the part of an IR spectrum below about 1500 cm⁻¹. Its pattern is often unique to a particular compound and can be used to confirm identity by comparison with a reference spectrum.
Two compounds may have similar functional group absorptions but different fingerprint regions. This is especially useful for distinguishing structural isomers.
Using IR to monitor reactions
IR spectroscopy can show whether a reaction has happened by tracking the disappearance of reactant absorptions and the appearance of product absorptions.
For example, when propan-2-ol is oxidised to propanone, the O-H absorption of the alcohol should disappear and a C=O absorption should appear.
CH₃CH(OH)CH₃ + [O] → CH₃COCH₃ + H₂O
Monitoring oxidation of an alcohol
A sample of propan-2-ol is heated with acidified potassium dichromate(VI). The product spectrum has no broad absorption at 3230–3550 cm⁻¹ but has a strong absorption at 1715 cm⁻¹. Explain what this shows.
-
The disappearance of the broad 3230–3550 cm⁻¹ absorption shows that the alcohol O-H bond is no longer present in the product.
-
The new strong absorption at 1715 cm⁻¹ shows that a carbonyl C=O bond has formed.
-
The loss of O-H and formation of C=O are consistent with oxidation of the secondary alcohol propan-2-ol to the ketone propanone.
Infrared spectroscopy and greenhouse gases
Some atmospheric gases absorb infrared radiation emitted from the Earth’s surface. This contributes to the greenhouse effect, where energy is retained in the atmosphere and the Earth’s average temperature is increased.
Important greenhouse gases include:
- water vapour, H₂O
- carbon dioxide, CO₂
- methane, CH₄
Molecules such as N₂ and O₂ are poor infrared absorbers because their vibrations do not cause a changing dipole moment. Carbon dioxide is overall non-polar, but some of its vibrations, such as bending and asymmetric stretching, do cause a change in dipole moment, so CO₂ can absorb IR radiation.
Non-polar overall does not always mean IR-inactive
A molecule can be non-polar overall but still have IR-active vibrations if the vibration causes a temporary change in dipole moment. CO₂ is the key A-Level example.
What IR can and cannot tell you
IR is powerful, fast and needs only a small sample, but it is not usually enough to determine a full structure on its own.
IR is good for:
- identifying functional groups
- checking whether a reaction has occurred
- comparing a sample spectrum with a known reference spectrum
- detecting certain impurities
IR is less good for:
- finding the exact carbon skeleton
- telling you the number of each type of hydrogen atom
- determining molecular mass
For full structural analysis, IR is often combined with other techniques such as mass spectrometry and NMR spectroscopy.
In the exam
- Read the axes carefully: absorptions usually appear as downward peaks, and wavenumber decreases from left to right.
- Use the data booklet ranges, but think about shape too: broad O-H and strong sharp C=O are especially important.
- Combine evidence from present and absent peaks; do not identify a compound from one absorption alone.
- Use the fingerprint region to confirm identity by comparison with a known spectrum, not by assigning every small peak.
- For reaction monitoring, state which peak disappears, which peak appears, and what functional group change this proves.
Check yourself
- How would you distinguish an alcohol from a carboxylic acid using IR spectroscopy?
- A spectrum has a strong absorption around 1700 cm⁻¹ but no broad O-H absorption. What types of compounds could it suggest?
- Why can CO₂ absorb infrared radiation even though the molecule is linear and overall non-polar?