

Welcome to the A-Level extension of titrations! You already know how to perform a basic titration from your AS studies. Now, we are going to look closer at exactly how the pH changes drop by drop during the reaction, and why we use different chemical indicators for different acid–base combinations.
What you'll learn:
- How to sketch and explain the four typical pH curves for combinations of strong and weak monoprotic acids and bases.
- How to interpret pH curves to find the equivalence point and the half-equivalence point.
- How to use a pH curve to select an appropriate indicator.
- How to perform calculations for these titrations using experimental data.
Measuring pH changes (Required Practical 9)
In a standard titration, you use an indicator to tell you when neutralization has occurred. However, to draw a pH curve, you need continuous data. Instead of relying on a human eye and a sudden colour change, you use a pH meter.
Typically, you place a known volume of acid into a conical flask and add your base from a burette in small increments (e.g., 1 cm31\text{ cm}^31 cm3 at a time, dropping to 0.1 cm30.1\text{ cm}^30.1 cm3 near the endpoint). After each addition, you swirl the flask and record the exact pH. Plotting these values gives you a pH curve.
Calibrating your equipment
A pH meter must be calibrated before use. You do this by dipping the probe into several standard buffer solutions of known pH (usually pH 4.0, 7.0, and 10.0) and adjusting the meter to read these values exactly. Uncalibrated meters can drift and give wildly inaccurate readings!
The four shapes of pH curves
The shape of a pH curve depends entirely on whether your acid and base are strong (fully dissociate in solution) or weak (only partially dissociate). There are four possible combinations you must be able to sketch and identify.
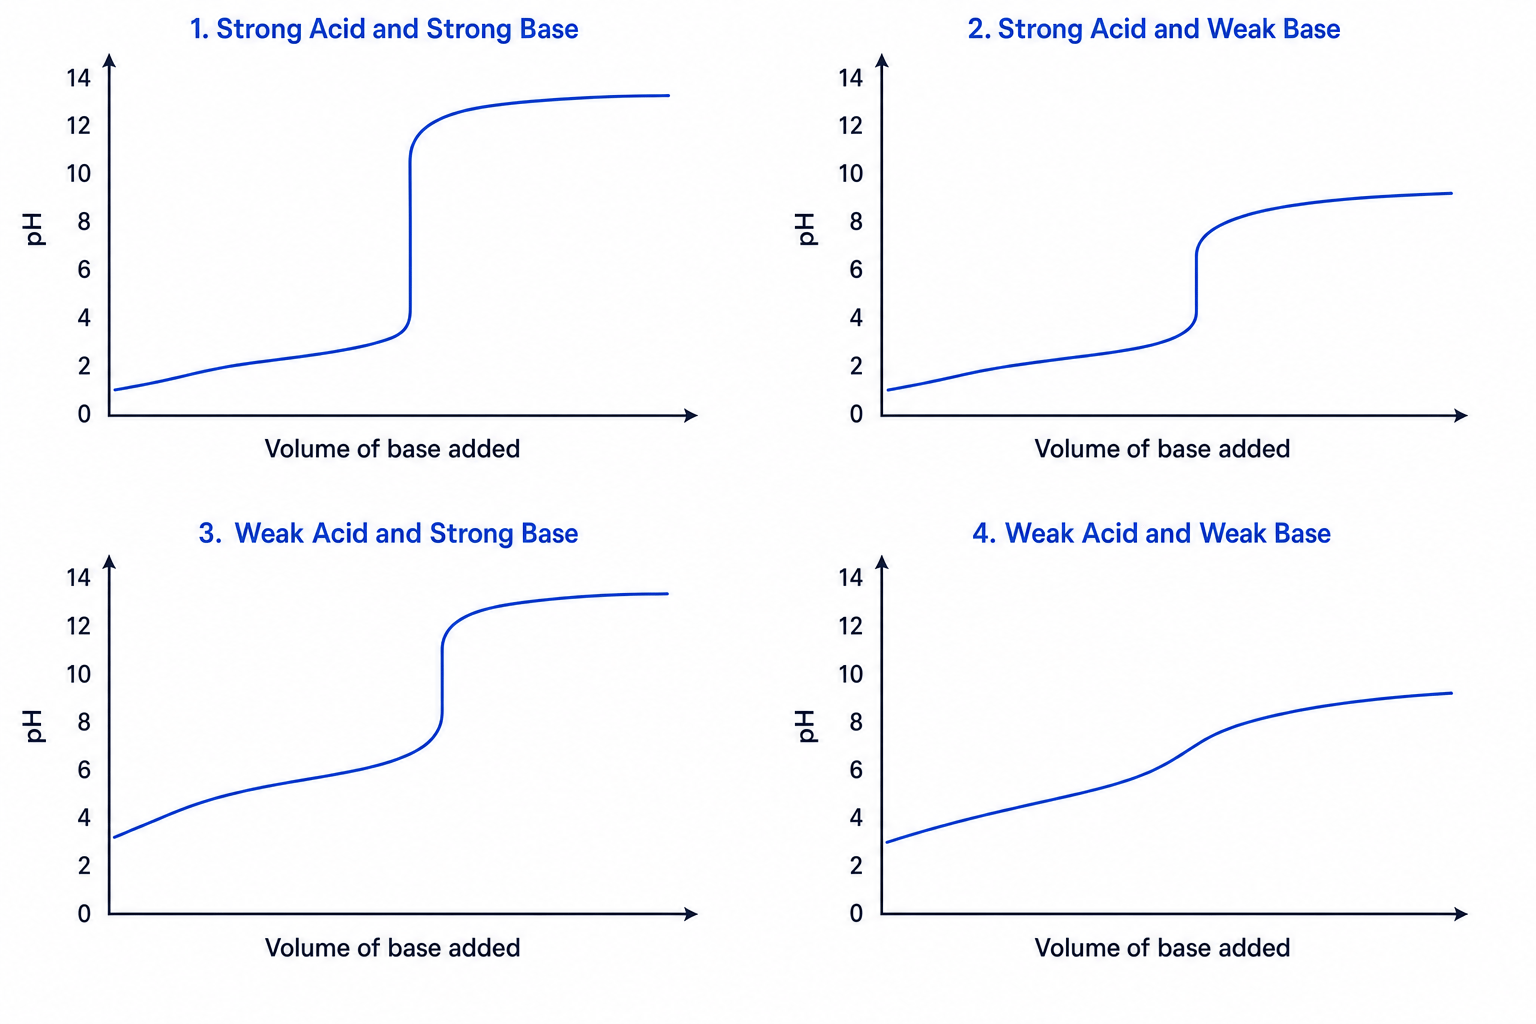
When interpreting or sketching these graphs, pay close attention to the starting pH, the ending pH, and the length of the steep vertical section:
- Strong Acid and Strong Base: The curve starts very low (around pH 1). There is a massive, sharp vertical section from roughly pH 3 to pH 11. It finishes high (around pH 13 or 14).
- Strong Acid and Weak Base: The curve starts very low (around pH 1). The vertical section is shorter, spanning from about pH 3 to pH 7. It finishes lower down (around pH 9).
- Weak Acid and Strong Base: The curve starts higher (around pH 3). The vertical section is also shorter, but it sits higher up, spanning from about pH 7 to pH 11. It finishes high (around pH 13 or 14).
- Weak Acid and Weak Base: The curve starts around pH 3 and finishes around pH 9. Noticeably, there is no sharp vertical section at all — it just looks like a steady "S" shape (an inflection point).
The Equivalence Point
The most important feature of any pH curve (except weak acid–weak base) is the steep vertical line.
Equivalence point
The equivalence point is the exact point during a titration when the amount of acid added fully reacts with the amount of base present (or vice versa). The moles of H+\text{H}^+H+ equal the moles of OH−\text{OH}^-OH−. On a pH curve, it is the exact centre of the vertical section.
Equivalence point vs End point
Don't confuse the equivalence point with the end point! The equivalence point is the theoretical point where the moles of acid and base match exactly based on stoichiometry. The end point is simply the volume at which your chosen indicator happens to change colour. If you choose the wrong indicator, your end point will happen at the wrong volume, ruining your titration!
The Half-Equivalence Point
For titrations involving a weak acid, there is a special point on the curve exactly halfway to the equivalence volume, known as the half-equivalence point.
At this exact volume, half of the weak acid (HA\text{HA}HA) has been neutralised and converted into its salt (A−\text{A}^-A−). Because [HA]=[A−][\text{HA}] = [\text{A}^-][HA]=[A−], the terms cancel out in the KaK_aKa expression:
Ka=[H+][A−][HA]⇒Ka=[H+] K_a = \frac{[\text{H}^+][\text{A}^-]}{[\text{HA}]} \quad \Rightarrow \quad K_a = [\text{H}^+] Ka=[HA][H+][A−]⇒Ka=[H+]Taking the negative logarithm of both sides gives a very powerful shortcut:
pKa=pH \text{p}K_a = \text{pH} pKa=pHBy reading the pH at exactly half the equivalence volume on a weak acid pH curve, you can instantly find the pKa\text{p}K_apKa of that acid!
Choosing the right indicator
An indicator is typically a weak acid where the un-ionised form (HA\text{HA}HA) is a different colour from the ionised form (A−\text{A}^-A−). Because it is an acid, it changes colour over a specific, narrow pH range.
To get an accurate titration, one single drop of reactant from the burette needs to cause a massive jump in pH so that the indicator changes colour instantly.
The Golden Rule of Indicators
For an indicator to be suitable, its entire colour-change pH range must fall completely within the steep vertical section of the titration's pH curve.
There are two main indicators you need to know:
- Methyl orange: Changes colour between pH 3.1 and 4.4 (Red in acid, Yellow in alkali).
- Phenolphthalein: Changes colour between pH 8.3 and 10.0 (Colourless in acid, Pink in alkali).
Let's apply the rule to the curves:
- Strong Acid / Strong Base: The vertical section is huge (pH 3 to 11). Both methyl orange and phenolphthalein fall within this range, so you can use either!
- Strong Acid / Weak Base: The vertical section is low (pH 3 to 7). Only methyl orange works here. Phenolphthalein would change colour far too gradually and way past the equivalence point.
- Weak Acid / Strong Base: The vertical section is high (pH 7 to 11). Only phenolphthalein works here.
- Weak Acid / Weak Base: There is no steep vertical section! Therefore, no indicator is suitable for a weak acid–weak base titration. You must use a pH meter instead.
Titration calculations
Once you have identified the equivalence volume from a pH curve (or a regular titration), you can calculate the unknown concentration. The standard approach uses the core formula n=c×Vn = c \times Vn=c×V.
Calculating the concentration of a weak acid
A student titrates a 25.0 cm325.0\text{ cm}^325.0 cm3 sample of unknown ethanoic acid (CH3COOH\text{CH}_3\text{COOH}CH3COOH) with 0.150 mol dm−30.150\text{ mol dm}^{-3}0.150 mol dm−3 sodium hydroxide (NaOH\text{NaOH}NaOH). The pH curve shows the equivalence point occurs when exactly 22.40 cm322.40\text{ cm}^322.40 cm3 of NaOH has been added.
Calculate the concentration of the ethanoic acid in mol dm−3\text{mol dm}^{-3}mol dm−3.
- First, calculate the moles of the known substance (NaOH) used to reach the equivalence point. Ensure the volume is converted to dm3\text{dm}^3dm3.
- Use the balanced equation to find the moles of the unknown substance (CH3COOH\text{CH}_3\text{COOH}CH3COOH). Ethanoic acid is monoprotic, so it reacts with NaOH in a 1:1 ratio.
- Calculate the concentration of the ethanoic acid using its original volume (25.0 cm325.0\text{ cm}^325.0 cm3).
In the exam
- When asked to sketch a pH curve, always clearly mark your start and end points first. If it's a strong acid, start at ~1; weak acid ~3. Strong base ends at ~13; weak base ~9.
- Ensure your steep vertical section matches the combination. Make it perfectly vertical for a few pH units.
- If asked to justify your choice of indicator, don't just say "it changes colour at the equivalence point". State the specific pH range of the indicator and explicitly write that "this range falls entirely within the steep vertical section of the pH curve".
Check yourself
- Can you draw all four pH curve shapes from memory, ensuring the vertical sections span the correct pH numbers?
- Which indicator would you select for a titration between hydrochloric acid and ammonia, and why?
- How would you find the pKa\text{p}K_apKa of a weak acid just by looking at its titration curve with a strong base?
