What you'll learn
- What a Maxwell–Boltzmann distribution curve shows for gas molecules.
- How to describe the key features of the curve correctly.
- How increasing temperature changes the shape of the distribution.
- How to link the curve to activation energy, successful collisions, and reaction rate.
The starting idea: gas molecules are moving
In a gas, particles are far apart and move randomly in all directions. They collide with each other and with the walls of their container.
Kinetic energy
Kinetic energy is the energy a particle has because it is moving. Faster particles have greater kinetic energy.
At any instant, the molecules in a gas do not all have the same kinetic energy. Some are moving slowly, some have moderate energy, and a small number are moving very quickly.
This happens because particles continually collide and exchange energy. One molecule may lose kinetic energy in a collision while another gains it.
Particles have a spread of energies
Even at one fixed temperature, gas molecules have a range of kinetic energies, not one single energy.
Temperature and molecular energy
Temperature
Temperature is a measure of the average kinetic energy of particles. In chemistry, temperature must often be measured on the Kelvin scale, K.
If you increase the temperature of a gas, the molecules have greater kinetic energy on average. This does not mean every single molecule has exactly the same increase in energy. Instead, the whole spread of energies changes.
A higher temperature means:
- fewer molecules have very low energy
- more molecules have high energy
- the average energy increases
What is a Maxwell–Boltzmann distribution?
Maxwell–Boltzmann distribution
A Maxwell–Boltzmann distribution is a curve showing how the energies of molecules in a gas are spread out at a particular temperature.
For A-Level Chemistry, you normally use the Maxwell–Boltzmann distribution to show molecular energies in a gas.
The graph has:
- Energy, EEE, on the x-axis
- Number of molecules on the y-axis
The curve shows how many molecules have each energy.
The shape of the curve
A Maxwell–Boltzmann distribution has a very distinctive shape.
It starts at the origin
The curve starts at the origin because no molecules have exactly zero energy at a temperature above 0 K.
It rises to a peak
The peak represents the most probable energy.
Most probable energy
The most probable energy is the energy possessed by the greatest number of molecules. It is shown by the highest point on the curve.
The most probable energy is not the same as the mean energy. The mean energy lies further to the right because the long high-energy tail pulls the average upwards.
It has a long tail to the right
A small number of molecules have very high energies. The curve tails off towards the energy axis, but it does not suddenly stop.
No maximum energy
There is no fixed maximum molecular energy. Very high-energy molecules are rare, but possible.
The area under the curve matters
The area under the curve represents the total number of molecules in the sample.
If you compare the same amount of gas at two different temperatures, the total number of molecules is the same, so the total area under each curve is the same.
Thinking a taller peak means more molecules overall
A taller peak does not mean there are more molecules in total. For the same sample, the total area under the curve stays the same. A taller peak just means more molecules are clustered around that energy.
Interpreting areas under the curve
A sample contains 3.00×10233.00 \times 10^{23}3.00×10²³ gas molecules. At a certain temperature, 1.5% of the molecules have energy greater than or equal to a chosen value.
-
Convert the percentage into a decimal fraction: 1.5% means 1.5100=0.015\frac{1.5}{100} = 0.0151001.5=0.015.
-
Multiply the total number of molecules by this fraction:
- So the number of molecules with energy greater than or equal to that value is 4.50×10214.50 \times 10^{21}4.50×10²¹ molecules.
Activation energy and successful collisions
Activation energy
The activation energy, EaE_aEa, is the minimum energy that colliding particles must have for a reaction to occur.
A collision only leads to reaction if the particles collide with:
- at least the activation energy, EaE_aEa
- a suitable orientation
A collision that leads to reaction is called a successful collision.
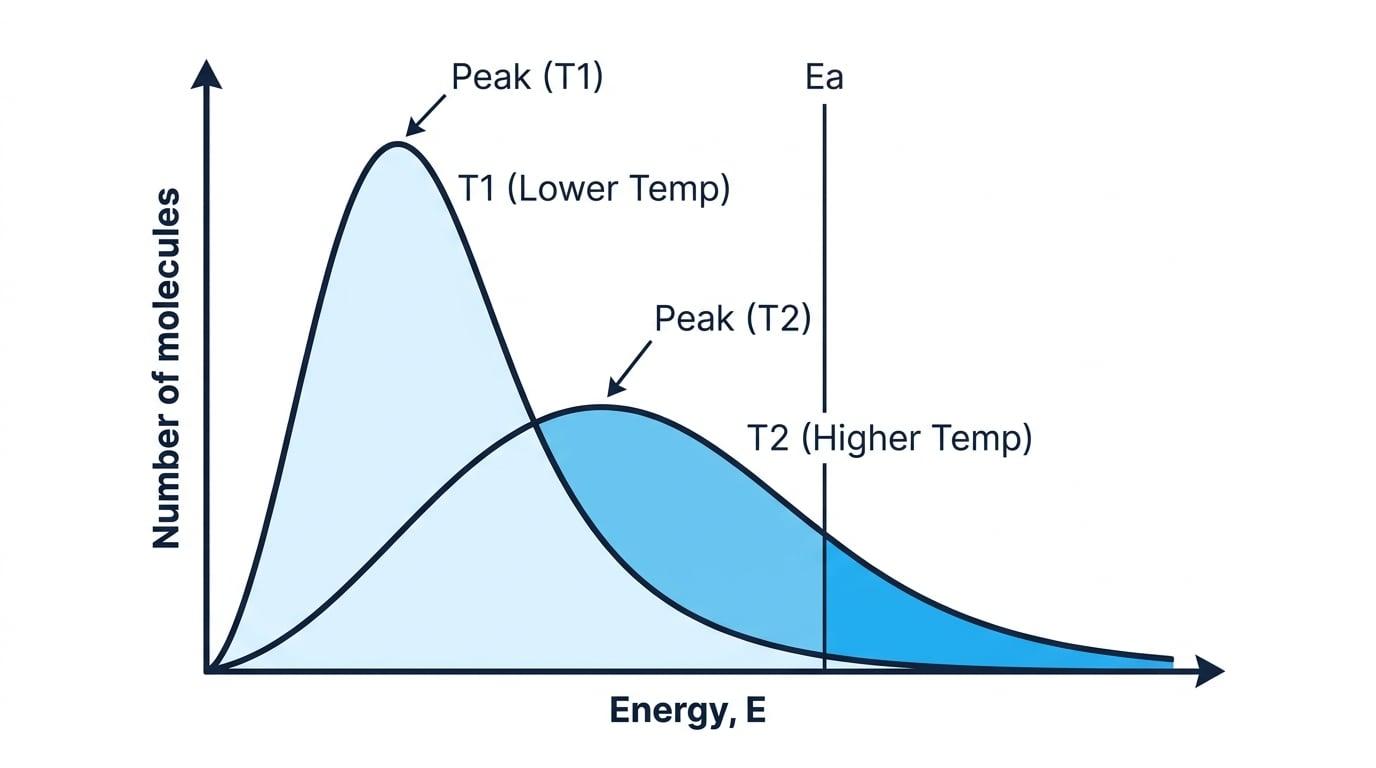
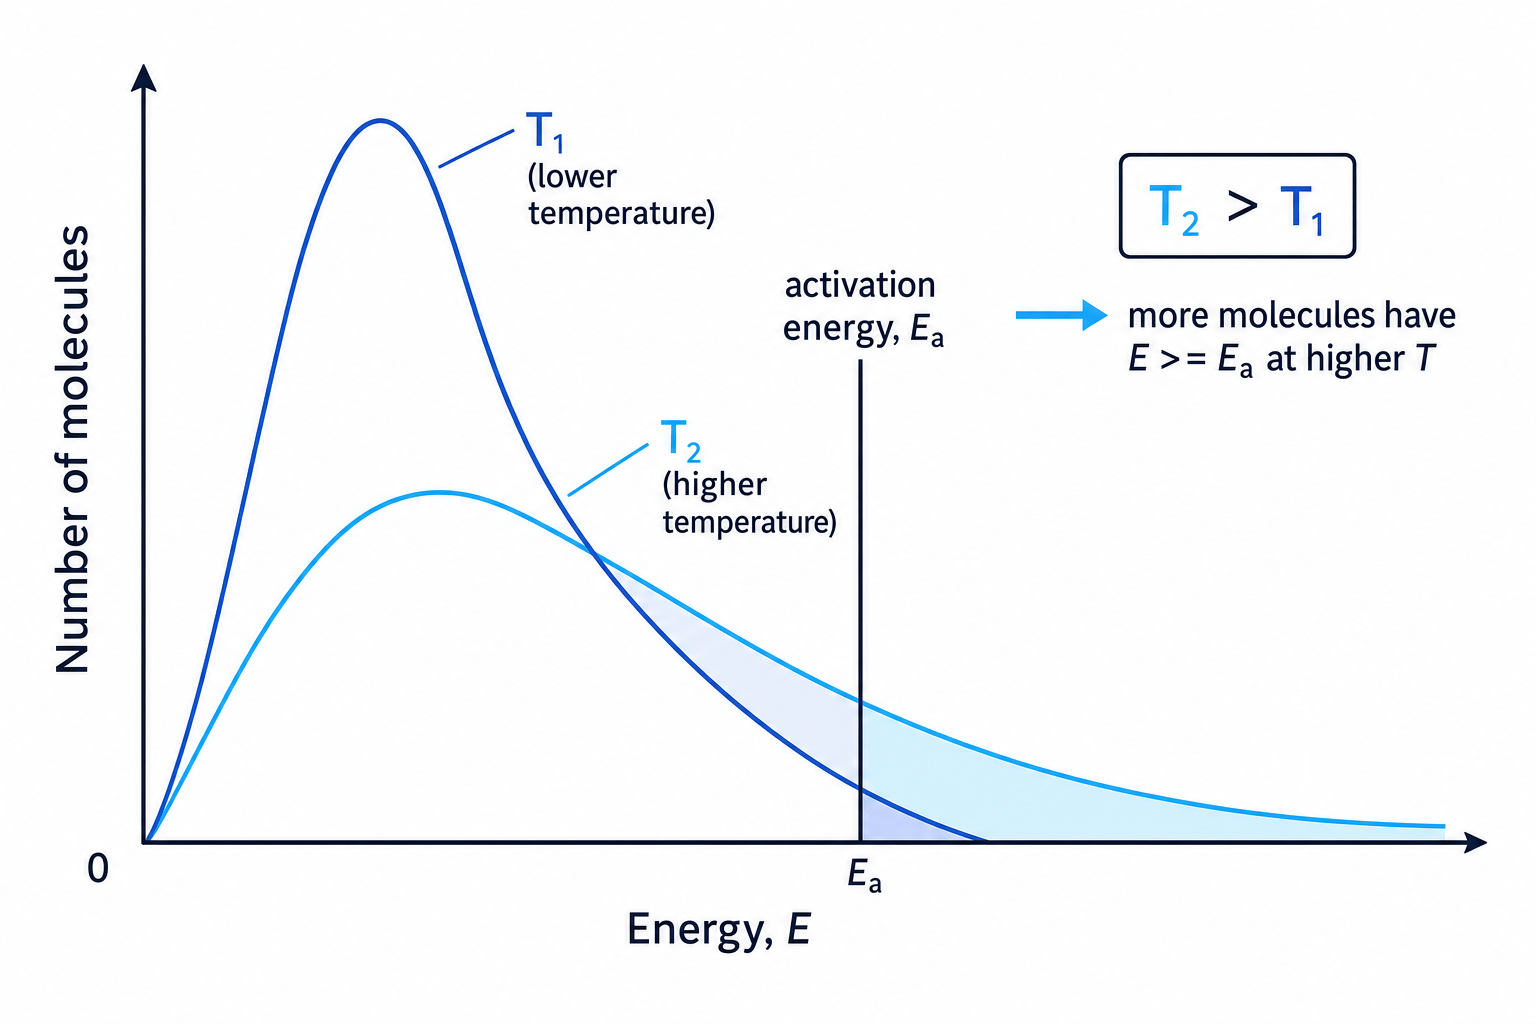
On a Maxwell–Boltzmann distribution, EaE_aEa is shown as a vertical line. Molecules to the right of this line have energy greater than or equal to EaE_aEa.
Area to the right of Ea
The area under the curve to the right of EaE_aEa represents the number of molecules with enough energy to react.
If this area is larger, a greater proportion of molecules have enough energy for successful collisions, so the reaction rate is higher.
Linking a curve to reaction rate
A Maxwell–Boltzmann distribution shows that, at temperature T1T_1T1, a small area lies to the right of EaE_aEa. At a higher temperature, T2T_2T2, this area is much larger.
-
The area to the right of EaE_aEa represents molecules with energy greater than or equal to the activation energy.
-
At T2T_2T2, this area is larger, so a greater proportion of molecules have E≥EaE \ge E_aE≥Ea.
-
Therefore, more collisions have enough energy to be successful, so the reaction rate increases.
What happens when temperature increases?
When temperature increases, the Maxwell–Boltzmann distribution changes shape.
Compared with the lower-temperature curve, the higher-temperature curve is:
- lower at the peak
- broader and flatter
- shifted to the right
- higher in the high-energy tail
- still the same total area, if the number of molecules is unchanged
This is because the molecules have a greater average kinetic energy.
Why the peak gets lower
The curve becomes more spread out. Since the total area under the curve remains the same for the same number of molecules, a broader curve must have a lower peak.
Why the peak moves right
The most probable energy increases, so the peak shifts to a higher energy.
Why the high-energy tail becomes more important
The biggest effect on rate comes from the increase in the number of molecules with energy greater than or equal to EaE_aEa.
Even a small temperature increase can cause a large increase in this fraction, especially if EaE_aEa is well into the tail of the original curve.
The key rate phrase
For temperature and rate questions, aim to say: a greater proportion of molecules have energy greater than or equal to the activation energy, so more collisions are successful per unit time.
Drawing the higher-temperature curve
You are given a Maxwell–Boltzmann distribution at temperature T1T_1T1 and asked to draw the curve at a higher temperature T2T_2T2.
-
Keep the curve starting at the origin, because the graph still represents molecular energies in a gas.
-
Draw the new peak lower and further to the right, because the molecules have greater average kinetic energy and the energies are more spread out.
-
Make the high-energy tail of the T2T_2T2 curve lie above the T1T_1T1 curve at large values of EEE, so that more molecules have high energies.
-
Keep the total area under the two curves the same if the amount of gas is unchanged.
How to describe the graph in words
Examiners often ask you to interpret or compare Maxwell–Boltzmann curves. Your explanation should connect the graph to particle energies.
For a higher temperature:
- the distribution shifts to higher energies
- the peak is lower and moves to the right
- the curve becomes broader
- the area to the right of EaE_aEa increases
- more molecules have energy greater than or equal to EaE_aEa
- the rate of reaction increases because there are more successful collisions per unit time
Saying all molecules have more energy
Do not say that all molecules have more energy at a higher temperature. Say that molecules have greater kinetic energy on average, and a greater proportion have energy greater than or equal to EaE_aEa.
Drawing Maxwell–Boltzmann curves accurately
When you draw the curve, focus on the chemistry rather than artistic perfection.
For one temperature
Your curve should:
- start at the origin
- rise steeply to a peak
- fall more gradually than it rose
- have a long tail to the right
- approach the x-axis but not touch it
For two temperatures
The higher-temperature curve should:
- start at the same origin
- have a lower peak
- have its peak further right
- cross the lower-temperature curve once
- have a larger area to the right of EaE_aEa
- have the same total area, if the number of molecules is the same
Do not move Ea when only temperature changes
If the question is about increasing temperature, the activation energy line stays in the same place. Temperature changes the distribution of molecular energies, not the value of EaE_aEa.
A quick comparison
Lower temperature:
- molecules have lower kinetic energy on average
- the curve is taller and narrower
- fewer molecules have E≥EaE \ge E_aE≥Ea
- the reaction is slower
Higher temperature:
- molecules have higher kinetic energy on average
- the curve is lower and broader
- more molecules have E≥EaE \ge E_aE≥Ea
- the reaction is faster
In the exam
-
If asked to draw the curve, label both axes: number of molecules and energy, EEE.
-
If comparing temperatures, describe both the shape change and the area to the right of EaE_aEa.
-
For rate explanations, use the phrase greater proportion of molecules have energy greater than or equal to EaE_aEa, then link this to more successful collisions per unit time.
Check yourself
- Why does the total area under the Maxwell–Boltzmann distribution stay the same for the same sample of gas?
- What does the area to the right of EaE_aEa represent?
- How does the curve change when temperature is increased?