What the curve shows
A Maxwell-Boltzmann distribution shows how molecular energies are spread in a gas at one temperature. The x-axis is energy, EEE, and the y-axis is number of molecules.
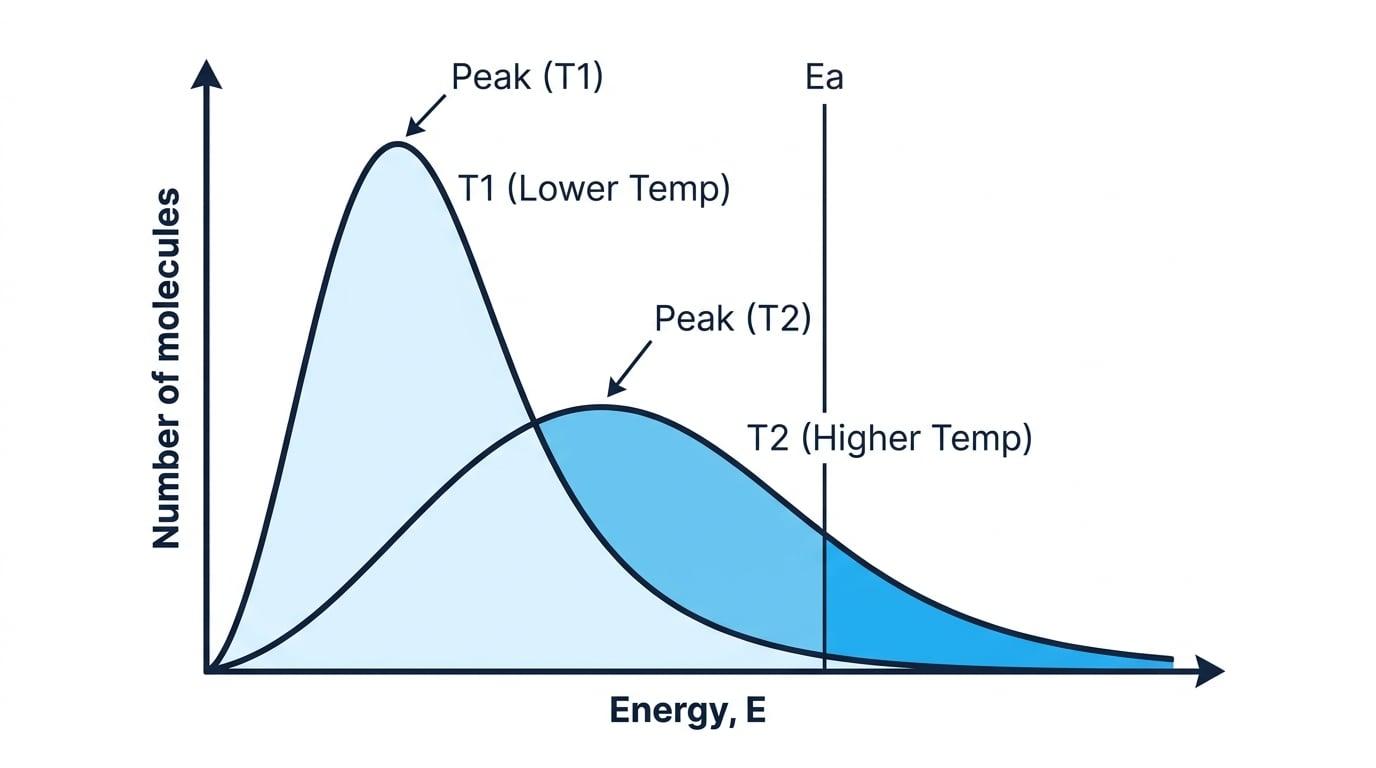 A Maxwell-Boltzmann distribution shows how molecular energies are spread in a gas at one temperature. The x-axis is energy, EEE, and the y-axis is number of molecules.