

What you'll learn
- What the rate of reaction actually means.
- How changing the temperature affects reaction rates qualitatively.
- How to draw and use the Maxwell-Boltzmann distribution to explain why a tiny temperature increase leads to a huge jump in reaction rate.
- How to investigate temperature and rate experimentally using the "disappearing cross" initial rate method (Required Practical 3).
What is the Rate of Reaction?
Before we look at temperature, we need to be clear on what a reaction rate actually is. When a chemical reaction happens, reactants are used up and products are formed.
Rate of reaction
The rate of reaction is defined as the change in concentration of a reactant or product per unit time. It is usually measured in mol dm−3 s−1\text{mol dm}^{-3}\text{ s}^{-1}mol dm−3 s−1.
For a reaction to occur, particles must collide with each other. But not every collision results in a reaction. To be successful, particles must collide with the correct orientation and possess a minimum amount of kinetic energy, known as the activation energy (EaE_aEa).
The Qualitative Effect of Temperature
Qualitatively, the rule is simple: increasing the temperature increases the rate of reaction.
When you heat a substance, you are supplying thermal energy which is converted into kinetic energy. The particles move faster. Because they are moving faster, they collide more frequently.
However, an increase in the frequency of collisions is actually only a tiny part of the story. If we only relied on particles hitting each other more often, the rate would only increase by a tiny fraction. Instead, a small increase in temperature (like turning up the dial by just 10 ∘C10 \text{ }^\circ\text{C}10 ∘C) can easily double the rate of a reaction. To understand why this happens, we must look at how the energy is distributed among the particles.
The Maxwell-Boltzmann Distribution
In any gas or liquid, particles do not all travel at the same speed. Some are sluggish, most are moving at a moderate pace, and a few are zooming around very quickly.
We can plot the kinetic energies of the particles on a graph called a Maxwell-Boltzmann distribution.
- The x-axis represents the kinetic energy of the particles (EEE).
- The y-axis represents the number of molecules with that specific energy.
If we draw the curve for a reaction at a lower temperature (T1T_1T1) and then draw it again for a higher temperature (T2T_2T2), it looks like this:
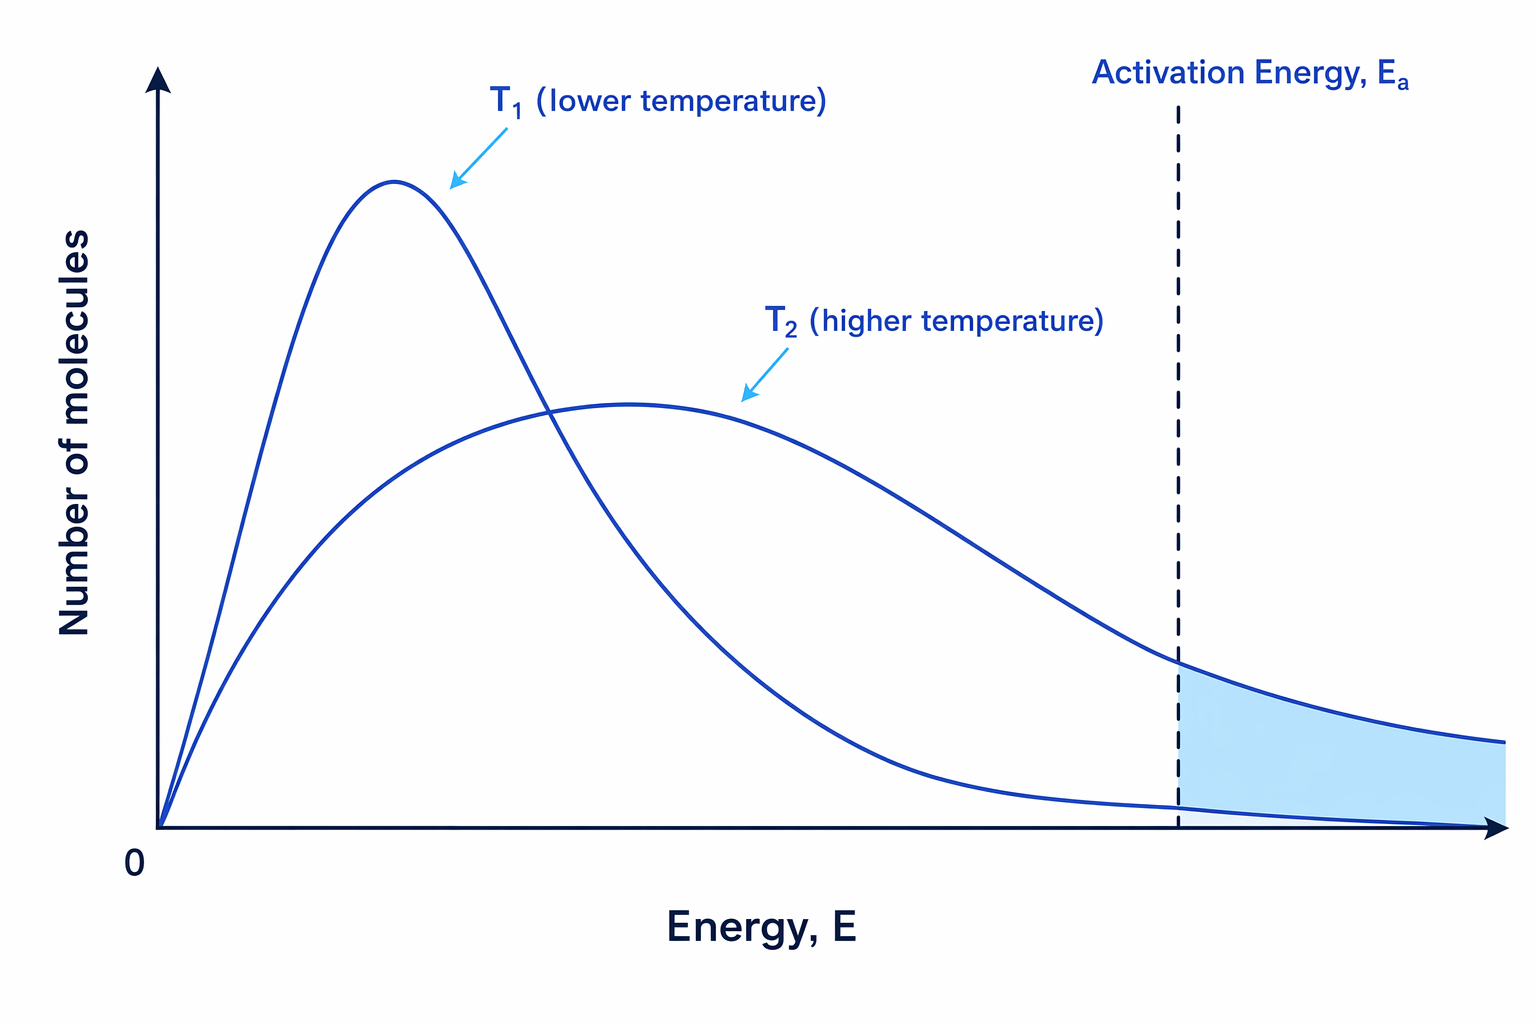
Notice how the shape of the curve changes when we heat the mixture to T2T_2T2:
- The peak is lower and shifted to the right: The most probable energy of a particle has increased, but fewer particles have this exact exact most probable energy because the distribution has spread out.
- The curve flattens and stretches: The total number of particles hasn't changed, so the total area under both curves must be exactly the same. To compensate for stretching further to the right, the peak must drop.
- The curves cross over: The T2T_2T2 curve dips below T1T_1T1 at lower energies, crosses it once, and then sits above T1T_1T1 at higher energies.
Drawing the curves in an exam
Always start both curves exactly at the origin (0,0)(0, 0)(0,0) because no particles have exactly zero energy. Make sure the curves never touch the x-axis at high energies (they are asymptotic). Finally, only cross the lines once — examiners actively look for this!
Why Rate Spikes at Higher Temperatures
Look closely at the right-hand side of the graph, beyond the activation energy (EaE_aEa) line. The area under the curve in this region represents the number of particles that have enough energy to react (E≥EaE \ge E_aE≥Ea).
At the higher temperature T2T_2T2, the curve sits significantly higher in this region.
The real reason rate spikes
A small increase in temperature leads to a large increase in the number of particles with energy greater than or equal to the activation energy. This causes a large increase in the frequency of successful collisions.
Frequency vs. Energy
If an exam question asks why temperature increases the rate, do not just say "particles collide more often". You will lose marks. You must explicitly mention that a much higher proportion of particles now have energy ≥Ea\ge E_a≥Ea, leading to more successful collisions per unit time.
Required Practical 3: Investigating Temperature and Rate
You need to know how to investigate this experimentally. A classic method is reacting sodium thiosulfate with hydrochloric acid.
The equation for the reaction is:
Na2S2O3(aq)+2HCl(aq)→2NaCl(aq)+SO2(g)+S(s)+H2O(l) \text{Na}_2\text{S}_2\text{O}_3\text{(aq)} + 2\text{HCl(aq)} \to 2\text{NaCl(aq)} + \text{SO}_2\text{(g)} + \text{S(s)} + \text{H}_2\text{O(l)} Na2S2O3(aq)+2HCl(aq)→2NaCl(aq)+SO2(g)+S(s)+H2O(l)As the reaction proceeds, solid sulfur (S\text{S}S) is produced as a yellow precipitate. This makes the initially clear solution gradually turn cloudy and opaque.
The Disappearing Cross Method
- Draw a dark cross on a piece of white paper and place a conical flask on top of it.
- Add a known volume and concentration of sodium thiosulfate to the flask.
- Warm the flask in a water bath to the desired temperature.
- Add the dilute hydrochloric acid and immediately start a stopwatch.
- Look down into the flask from above. Stop the stopwatch the exact moment the cross is no longer visible.
- Repeat the experiment at several different temperatures (e.g. 20 ∘C20 \text{ }^\circ\text{C}20 ∘C, 30 ∘C30 \text{ }^\circ\text{C}30 ∘C, 40 ∘C40 \text{ }^\circ\text{C}40 ∘C, 50 ∘C50 \text{ }^\circ\text{C}50 ∘C).
This is an initial rate method. Because we are measuring the time taken to produce the same fixed amount of sulfur (enough to obscure the cross), we can assume the initial rate is inversely proportional to the time taken.
We can calculate a value proportional to the rate by calculating 1t\frac{1}{t}t1.
Calculating proportional rate from reaction times
In a disappearing cross experiment at 45 ∘C45 \text{ }^\circ\text{C}45 ∘C, it takes 26 s26 \text{ s}26 s for the cross to disappear. Calculate a value proportional to the initial rate of reaction. Give your answer to two significant figures.
- Take the time value from the experiment: t=26 st = 26 \text{ s}t=26 s.
- Calculate the reciprocal to find the proportional rate:
- Round the final answer to two significant figures:
If you plot a graph of the proportional rate (1t\frac{1}{t}t1) on the y-axis against Temperature on the x-axis, you will see an exponential curve sweeping upwards. This visually confirms what the Maxwell-Boltzmann distribution tells us: as temperature climbs, the rate accelerates dramatically.
In the exam
- When sketching Maxwell-Boltzmann curves, visually check that the area under T2T_2T2 is roughly equal to T1T_1T1. If your T2T_2T2 curve looks like a giant mountain next to a tiny hill, you will lose the mark.
- Clearly label the axes: "Number of molecules" (or "Number of particles") and "Energy" (or "Kinetic Energy"). Never use "Enthalpy" or "Reaction path" — those are for energy profile diagrams!
- Be precise with your wording. Always say "many more particles have energy greater than or equal to the activation energy".
Check yourself
- Why does the peak of the Maxwell-Boltzmann distribution shift to the right and drop lower at higher temperatures?
- In the disappearing cross experiment, why is 1t\frac{1}{t}t1 an acceptable measure of the initial rate?
- What are the units for the proportional rate calculated using 1t\frac{1}{t}t1 if ttt is measured in seconds?
