The diagram illustrates the change in membrane potential of a sensory neurone associated with a Pacinian corpuscle following two different levels of mechanical pressure.
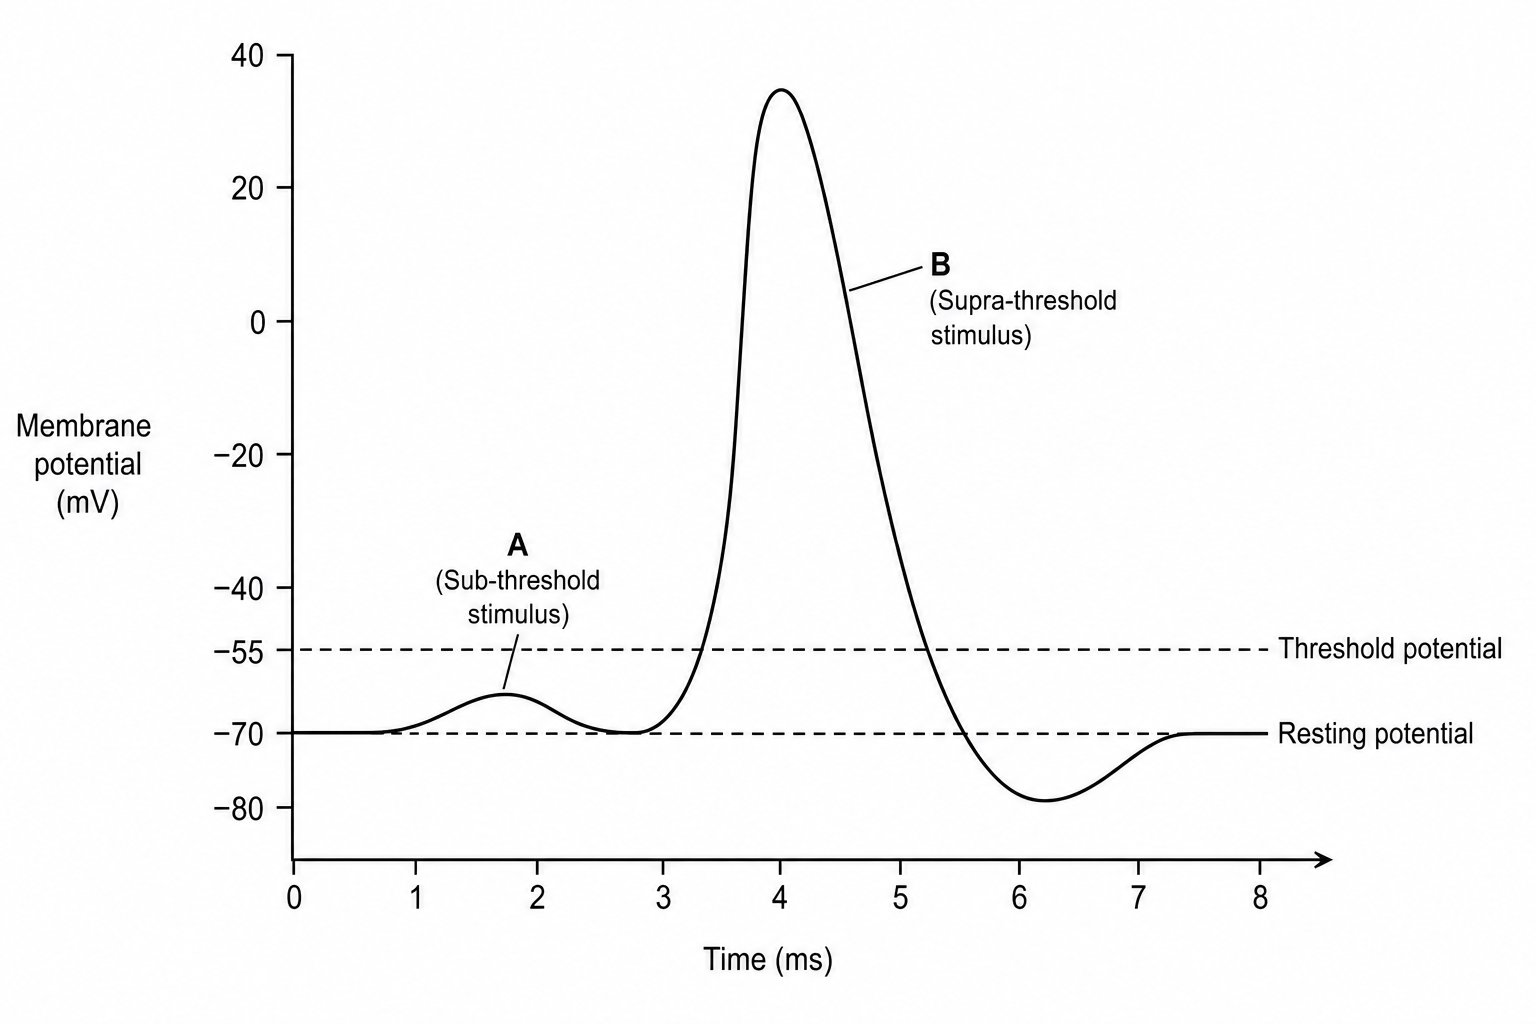
Which of the following statements correctly explains the electrical and ionic changes observed in curves A and B?
The repolarisation phase of curve B (from +35 mV+35\text{ mV}+35 mV down to −80 mV-80\text{ mV}−80 mV) is directly caused by the active transport of three Na+Na^+Na+ ions out for every two K+K^+K+ ions pumped in by the sodium-potassium pump.
In curve A, a generator potential is produced by the influx of Na+Na^+Na+ through stretch-mediated channels but fails to reach the threshold. In curve B, the threshold is exceeded, triggering the opening of voltage-gated Na+Na^+Na+ channels to generate an action potential.
If the mechanical pressure applied in curve B were doubled, the peak membrane potential reached would be approximately +70 mV+70\text{ mV}+70 mV due to a greater total influx of Na+Na^+Na+ ions.
The depolarisation in both curve A and curve B is initiated by the rapid efflux of K+K^+K+ ions down their electrochemical gradient.

