What you'll learn
- How to use practical apparatus and techniques correctly in Biology investigations.
- How to choose appropriate units for measurements and avoid unit mistakes.
- How to record observations and numerical data clearly.
- How examiners expect practical data to be presented in tables, graphs and written observations.
The big idea: what “implementing” means
In A-Level Biology, implementing is about carrying out practical work properly. You are not just “doing the experiment”; you are using the right apparatus, collecting measurements carefully, and recording what happens in a format that someone else could understand and analyse.
The OCR Practical Endorsement develops these skills in required practical work, but the written exams can also test whether you understand how good practical work is carried out.
Implementing
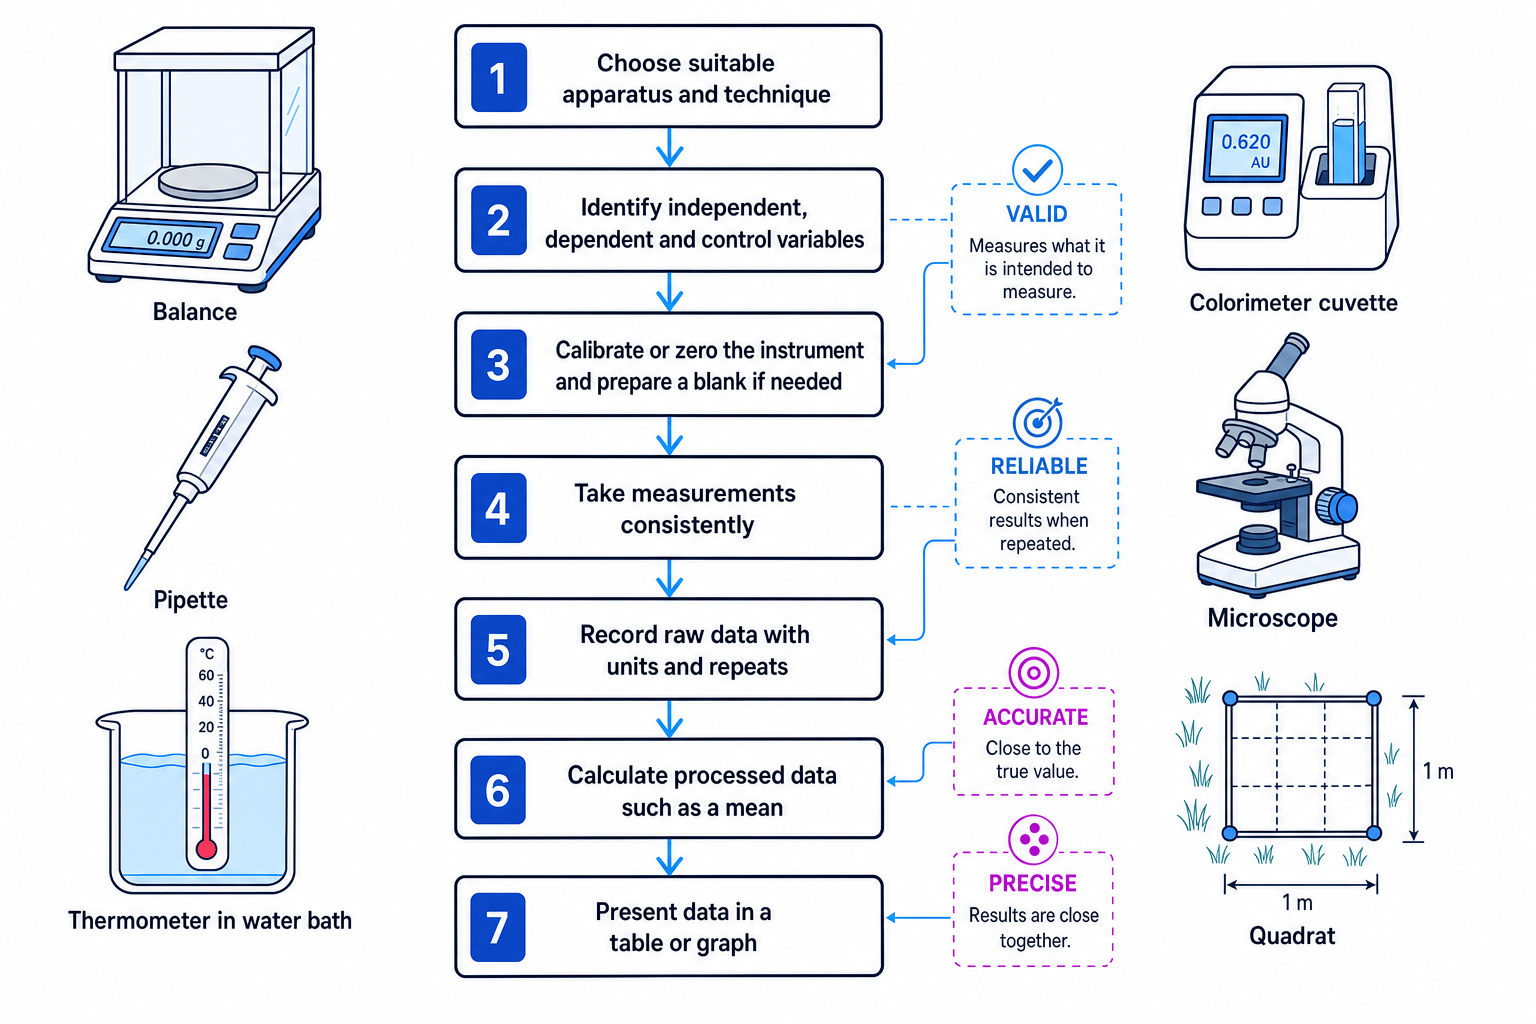
Implementing means carrying out a practical method accurately, safely and consistently so that the measurements and observations collected are valid, reliable and useful.
A valid measurement is one that measures what it is supposed to measure. A reliable result is consistent when the investigation is repeated. An accurate measurement is close to the true value, while precision describes how close repeated measurements are to each other.
Using practical apparatus and techniques correctly
Apparatus and technique
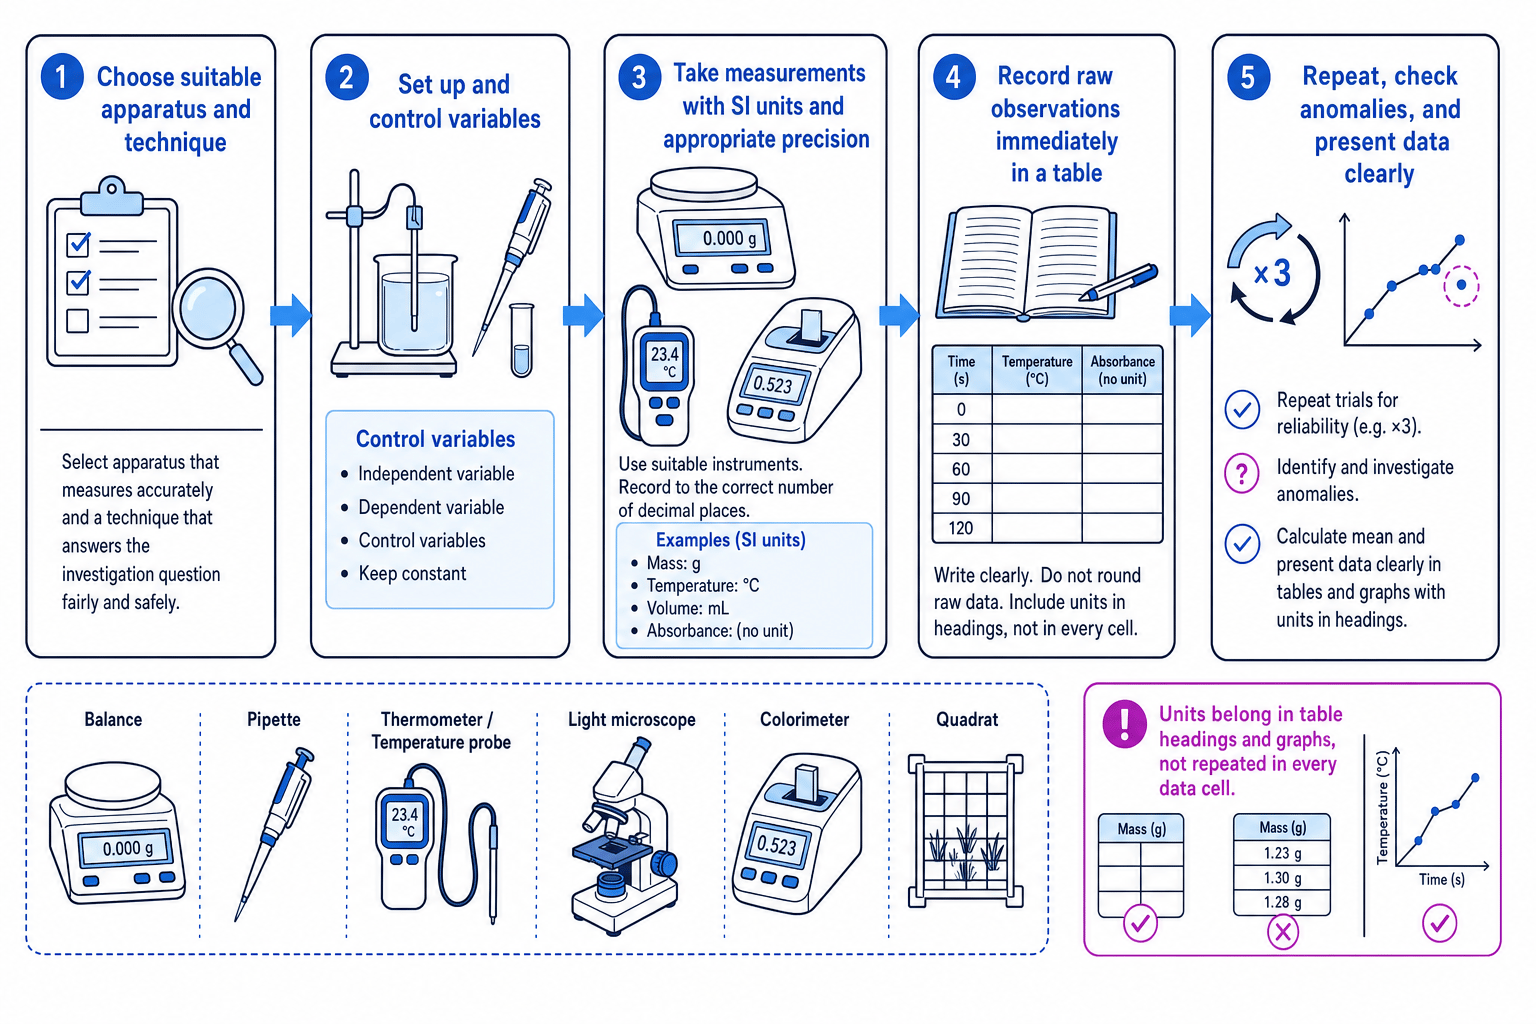
Apparatus means the equipment used in a practical investigation, such as a balance, pipette, microscope, colorimeter, thermometer, quadrat or data logger.
A technique is the method or skill used with the apparatus, such as focusing a microscope, using aseptic technique, carrying out a serial dilution, using a colorimeter, or sampling organisms with a quadrat.
You need to choose apparatus that matches the job. For example, a measuring cylinder may be suitable for approximate volumes, but a pipette is better when the exact volume matters.
Choose apparatus for the measurement
The “best” apparatus is not always the most complicated one. It is the apparatus that measures the correct variable with suitable accuracy, precision and safety.
Common biology apparatus: what examiners expect
| Apparatus or technique | Used for | Correct use to remember |
|---|---|---|
| Balance | Measuring mass | Tare the balance before use; record to the balance’s resolution. |
| Measuring cylinder | Measuring approximate volume | Read the meniscus at eye level. |
| Pipette or syringe | Measuring more precise volume | Avoid air bubbles; use the correct scale. |
| Thermometer or temperature probe | Measuring temperature | Allow the reading to stabilise before recording. |
| Water bath | Keeping temperature constant | Check the actual temperature, not just the setting. |
| Light microscope | Observing cells or tissues | Start on low power; focus using coarse then fine adjustment. |
| Colorimeter | Measuring absorbance or transmission | Use a blank to zero the instrument before measuring samples. |
| Quadrat or transect | Ecological sampling | Use random or systematic placement depending on the question. |
| Stopwatch or data logger | Measuring time or continuous change | Start timing at the same defined point each trial. |
Resolution and recording precision
The resolution of an instrument is the smallest change it can detect or display. For example, a balance reading to 0.01 g has a resolution of 0.01 g.
Resolution
Resolution is the smallest interval that an instrument can measure or display.
If a digital balance reads to 0.01 g, record masses to two decimal places, such as 1.20 g rather than 1.2 g. This shows the precision of the instrument and makes repeated readings comparable.
Choosing suitable apparatus
You are investigating how substrate concentration affects the rate of an enzyme-controlled reaction.
-
Identify the independent variable, which is the factor you deliberately change. Here, it is substrate concentration, so you need apparatus that can prepare accurate concentrations and volumes.
-
Identify the dependent variable, which is the factor you measure. If you are measuring colour change, a colorimeter gives a more objective measurement than judging colour by eye.
-
Identify important control variables, which are factors kept constant. Temperature and pH should be controlled using a water bath and buffer solution so that substrate concentration is the main factor affecting the result.
-
Choose apparatus with suitable precision. Pipettes or syringes are better than rough pouring when enzyme and substrate volumes must be consistent between trials.
Using the wrong level of precision
Do not record more decimal places than the apparatus can actually measure. A thermometer marked every 1 °C cannot justify a reading such as 23.47 °C.
Carrying out techniques consistently
Consistency matters
A method is only useful if it is applied in the same way each time. If you change several things at once, you cannot tell which factor caused the result.
For example, when comparing enzyme activity at different temperatures, you should keep enzyme concentration, substrate concentration, pH, total volume and timing method constant.
Calibration, zeroing and blanks
Calibration means checking or setting an instrument against a known standard. Zeroing means setting an instrument to read zero before use.
A blank is a control sample used to zero an instrument, especially a colorimeter. It contains everything except the substance that causes the measurement being investigated. For example, if you are measuring pigment concentration using a colorimeter, the blank might contain the solvent but no pigment.
Before taking readings
Ask yourself: “Has the instrument been zeroed, is the scale appropriate, and am I measuring the same thing each time?” This catches many practical errors before they affect your results.
Safety and contamination
Some techniques require extra care. Aseptic technique means using methods that prevent contamination by unwanted microorganisms. This includes sterilising equipment, keeping lids open for the shortest possible time, and working near a sterile zone when appropriate.
In microbiology practical work, plates are normally labelled on the base, incubated safely, and handled to reduce exposure to microorganisms. You do not need specialist medical-level detail, but you should understand the principle: prevent contamination and reduce risk.
Choosing appropriate units
A unit tells you the scale used for a measurement. For example, metres, seconds, grams, cubic centimetres and degrees Celsius are all units used in practical Biology.
Unit
A unit is the standard quantity used to express a measurement, such as seconds for time or micrometres for cell length.
OCR expects you to use appropriate units, especially in tables, graph axes and calculations. The unit must match the quantity measured.
Common Biology units
| Quantity | Appropriate units commonly used in Biology |
|---|---|
| Length | m, mm, µm, nm |
| Mass | kg, g, mg |
| Time | s, min |
| Volume | dm³, cm³, µL |
| Temperature | °C, K |
| Concentration | mol dm⁻³, g dm⁻³ |
| Pressure | kPa |
| Energy | J, kJ |
Use units that make the numbers sensible. A cell length is usually better recorded in micrometres rather than metres. A membrane thickness may be recorded in nanometres. Laboratory volumes are often measured in cubic centimetres or microlitres.
Units in the wrong place
In tables and graphs, put units in the column heading or axis label, not after every single data value. For example, use Temperature / °C as the heading, then write values such as 20, 30 and 40 in the column.
Unit conversions
Sometimes you need to convert between units before comparing values or carrying out a calculation.
Useful conversions include:
- 1 mm=1000 μm1\ \text{mm} = 1000\ \mu\text{m}1 mm=1000 μm
- 1 μm=1000 nm1\ \mu\text{m} = 1000\ \text{nm}1 μm=1000 nm
- 1 dm3=1000 cm31\ \text{dm}^3 = 1000\ \text{cm}^31 dm3=1000 cm3
- 1 cm3=1 mL1\ \text{cm}^3 = 1\ \text{mL}1 cm3=1 mL
Converting microscope measurements
A cell is measured as 0.085 mm long. Convert this length into micrometres.
-
Choose the correct conversion factor: 1 mm=1000 μm1\ \text{mm} = 1000\ \mu\text{m}1 mm=1000 μm.
-
Multiply the value in millimetres by 1000:
- Check whether the answer is biologically sensible. A length of 85 µm is reasonable for some large eukaryotic cells, whereas 0.085 µm would be too small for most whole cells.
Presenting observations and data
Observations versus data
An observation is something you notice during the practical. It may be qualitative or quantitative.
Qualitative observations are descriptive, such as “the solution changed from blue to orange”. Quantitative data are numerical, such as “the temperature was 35 °C” or “the absorbance was 0.42”.
Raw data
Raw data are the original measurements or observations recorded during the practical, before processing such as calculating a mean or drawing a graph.
Raw data should be recorded immediately. Do not rely on memory, and do not only record the “best” result. Repeats and anomalies are part of the evidence.
Good results tables
A good results table should:
- put the independent variable in the first column;
- put the dependent variable readings in later columns;
- include repeats where appropriate;
- include units in headings, not in every cell;
- record values to a consistent number of decimal places;
- separate raw data from processed data such as means.
Here is a suitable table structure for an investigation into the effect of temperature on pigment release from beetroot, measured using a colorimeter.
| Temperature / °C | Absorbance repeat 1 | Absorbance repeat 2 | Absorbance repeat 3 | Mean absorbance |
|---|---|---|---|---|
| 20 | 0.12 | 0.11 | 0.13 | 0.12 |
| 30 | 0.20 | 0.22 | 0.21 | 0.21 |
| 40 | 0.39 | 0.41 | 0.40 | 0.40 |
Absorbance is dimensionless, so it has no unit. If an instrument reports “arbitrary units”, you may state that, but do not invent a unit where none exists.
Designing a results table
You are recording the effect of temperature on absorbance in a colorimeter investigation.
-
Identify the independent variable: temperature. This belongs in the first column because it is the factor you changed deliberately.
-
Identify the dependent variable: absorbance. Because repeat readings are taken, each repeat should have its own column so the raw data remain visible.
-
Add a mean column only after the repeat columns. The mean is processed data, so it should not replace the original readings.
-
Put units in headings. Temperature needs °C in the heading, but absorbance has no unit, so the absorbance headings should not include one.
Presenting graphs
For most practical graphs:
- put the independent variable on the x-axis;
- put the dependent variable on the y-axis;
- include units in both axis labels where needed;
- choose a sensible scale that uses most of the graph paper;
- plot points accurately;
- draw a line of best fit or smooth curve only when appropriate.
A line graph is useful when both variables are continuous, such as temperature and rate. A bar chart is better when the independent variable is categoric, such as species or treatment group.
Graph choice shortcut
If the x-axis values are numbers on a continuous scale, consider a scatter graph or line graph. If the x-axis groups are categories, consider a bar chart.
Presenting written observations
For biological tests and microscopy, written observations must be specific. Instead of writing “positive result”, describe what you actually saw.
For example:
- Benedict’s test: “solution changed from blue to brick red precipitate”
- iodine test: “solution changed from orange-brown to blue-black”
- microscope observation: “cells were rectangular with visible cell walls and nuclei”
You can interpret the observation afterwards, but keep the observation itself clear and factual.
Writing conclusions instead of observations
“Starch is present” is a conclusion. “Iodine solution turned blue-black” is the observation that supports the conclusion.
In the exam
-
If asked about apparatus, link your choice to the measurement: precision, control of variables, safety or objectivity.
-
If asked to complete a table or graph, check headings first: quantity, unit, consistent decimal places and sensible layout.
-
If asked about observations, describe what is seen directly before giving the biological interpretation.
Check yourself
-
Why might a pipette be more suitable than a measuring cylinder in an enzyme investigation?
-
Where should units be written in a results table?
-
What is the difference between a qualitative observation and quantitative data?