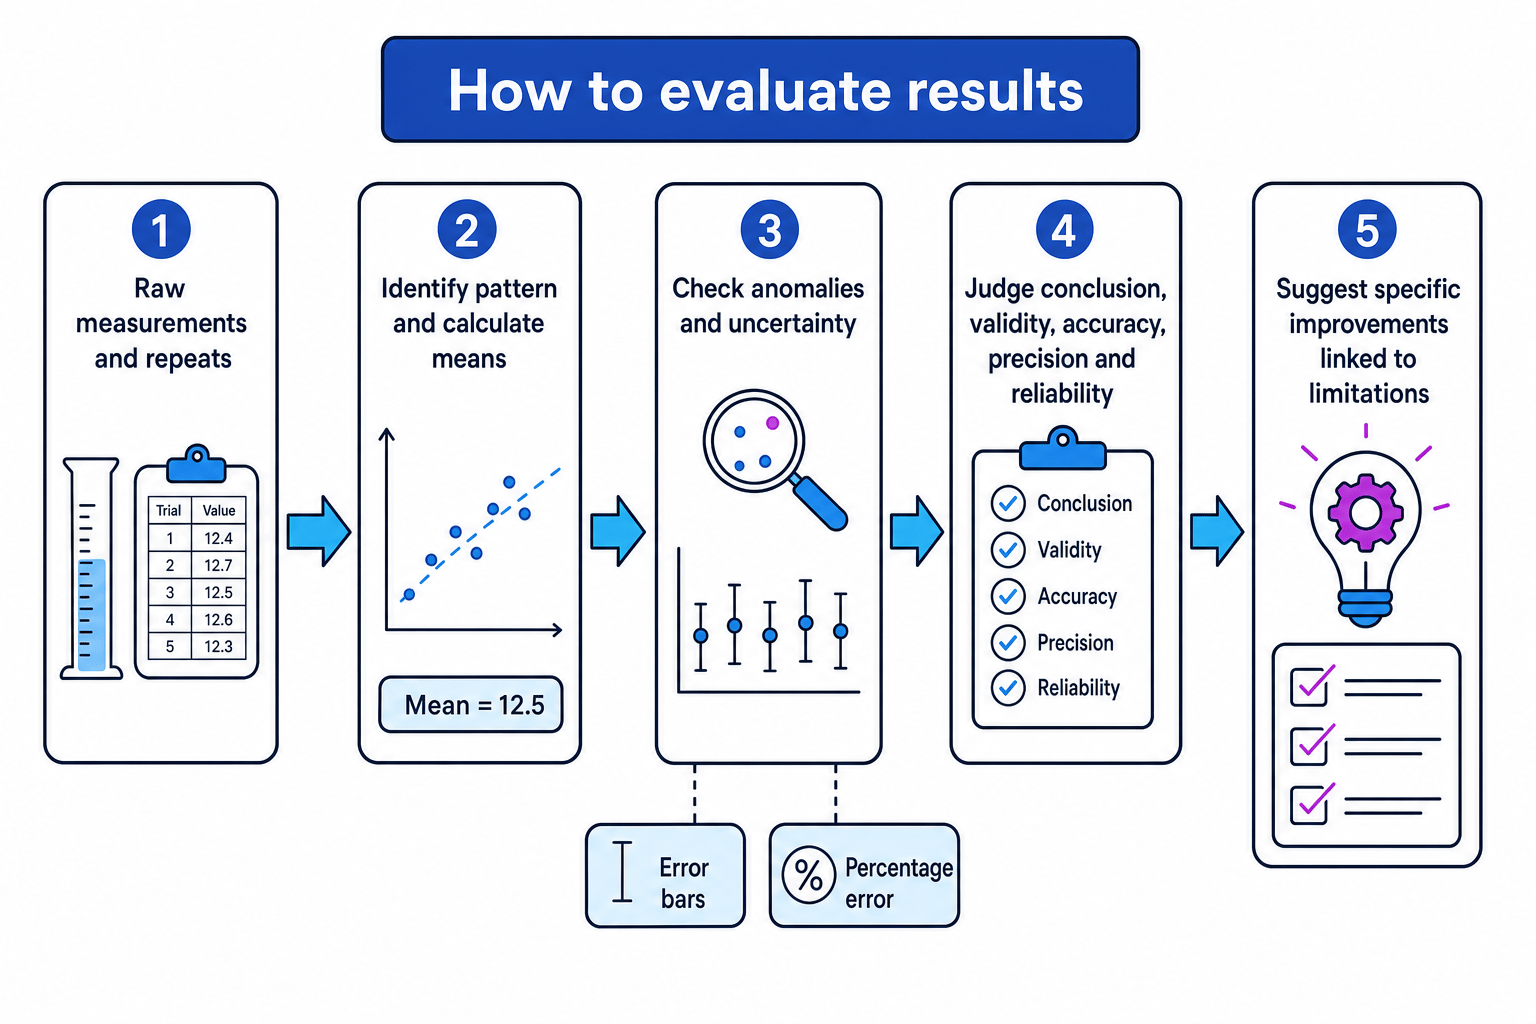
What you'll learn
- How to use results to draw a careful, evidence-based conclusion.
- How to identify anomalies and decide whether they should affect your interpretation.
- How to discuss accuracy, precision, margins of error, percentage error and apparatus uncertainty.
- How to suggest practical improvements that directly fix limitations.
Why evaluation matters
Evaluation is the skill of judging how good your experimental evidence is. In Biology practical questions, you are rarely rewarded for saying only “the results support the hypothesis”. You need to explain how strongly they support it, whether the method was valid, and what could be improved.
Evaluation
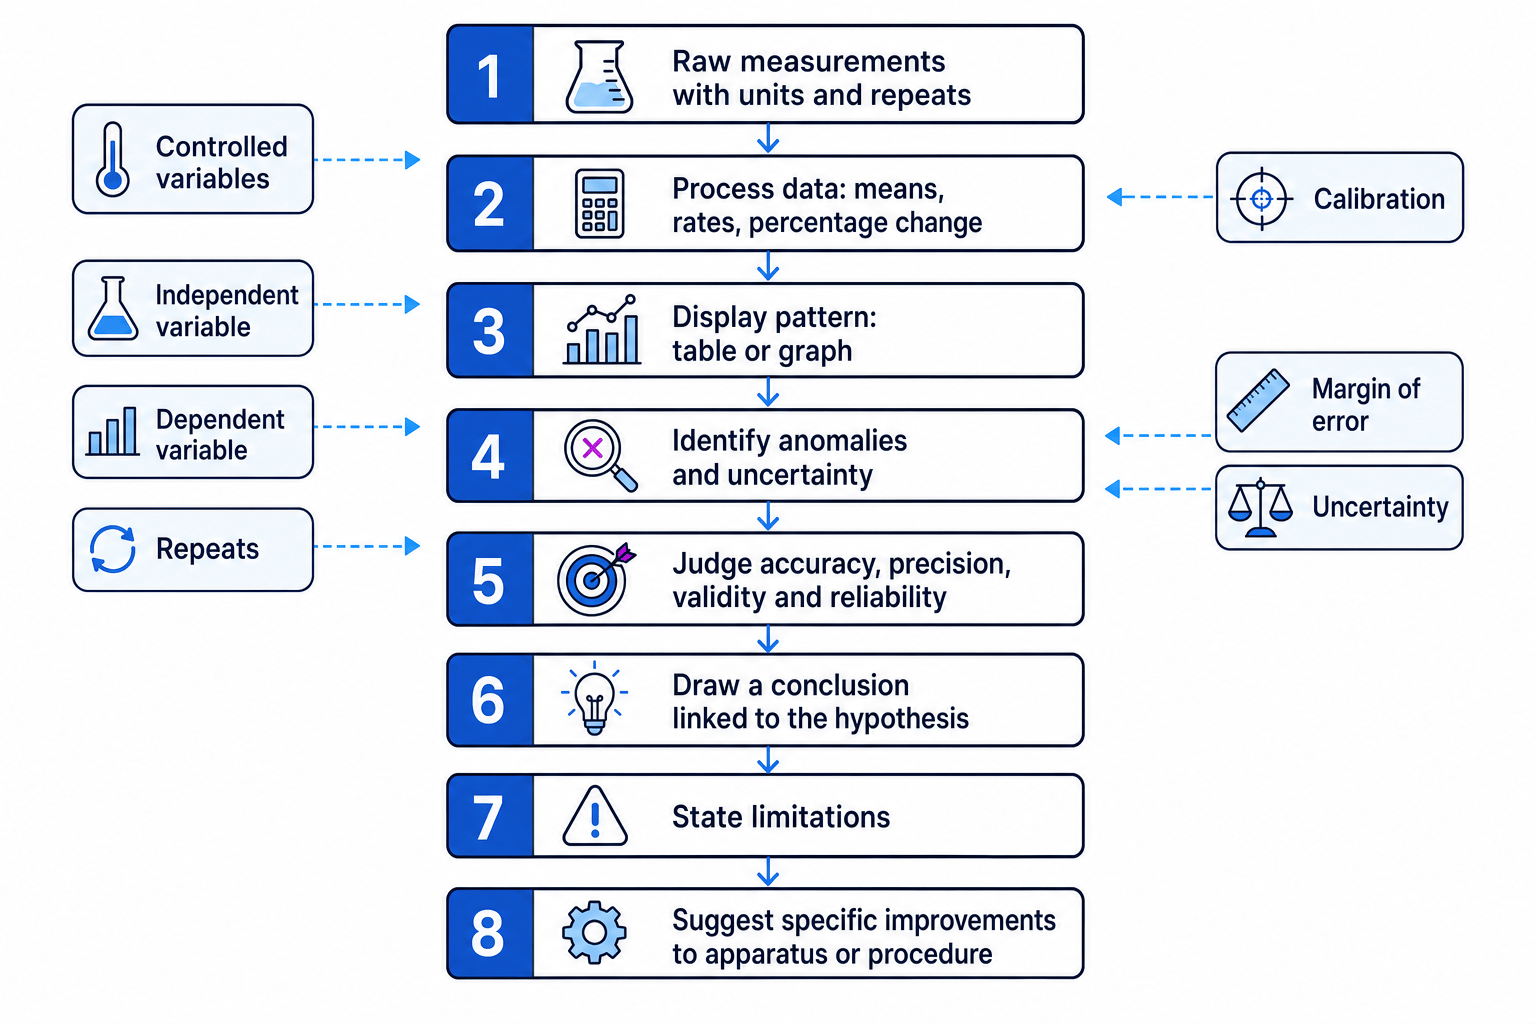
Evaluation means judging the quality of experimental results and methods, then using that judgement to draw a justified conclusion and suggest improvements.
A good evaluation usually asks:
- Do the results show a clear pattern?
- Are the results precise and repeatable?
- Are there anomalies?
- Are there limitations in the procedure or apparatus?
- Does the conclusion stay within what the data actually show?
Evidence before opinion
In evaluation questions, do not just state whether the experiment was “good” or “bad”. Link every judgement to evidence from the data or to a named feature of the method.
Drawing conclusions from results
A conclusion is a final statement that answers the investigation question using the results.
For example, if the investigation tested the effect of temperature on enzyme activity, the conclusion might state that the rate increased up to an optimum temperature, then decreased at higher temperatures.
Conclusion
A conclusion is a judgement based on experimental evidence. It should refer to the pattern in the data and, where possible, use figures from the results.
A strong biological conclusion usually includes:
- The overall relationship between variables.
- Relevant numerical evidence.
- A biological explanation, if the question asks for it.
- A recognition of uncertainty or limitations, if appropriate.
Correlation is not always causation
A correlation is a relationship between two variables. If one variable increases as another increases, that is a positive correlation. If one increases while the other decreases, that is a negative correlation.
However, a correlation does not automatically prove that one variable caused the other to change. In practical work, causation is stronger when:
- the independent variable was deliberately changed;
- other variables were controlled;
- the trend is consistent;
- repeats show similar results;
- the method is valid.
Drawing a justified conclusion
A student investigates the effect of light intensity on the rate of photosynthesis in pondweed. At 20 arbitrary units of light intensity, the mean rate is 4 bubbles per minute. At 80 arbitrary units, the mean rate is 13 bubbles per minute. At 100 arbitrary units, the mean rate is also 13 bubbles per minute.
-
Compare the dependent variable across the range: the rate increases from 4 bubbles per minute to 13 bubbles per minute as light intensity rises from 20 to 80 arbitrary units.
-
Check whether the pattern continues at the highest value: the rate remains at 13 bubbles per minute between 80 and 100 arbitrary units, so the increase has levelled off.
-
Link the conclusion to the investigation: increasing light intensity increases the rate of photosynthesis up to about 80 arbitrary units, after which light intensity is no longer the limiting factor.
-
Keep the conclusion within the data: the results do not prove which factor becomes limiting after 80 arbitrary units; it could be carbon dioxide concentration, temperature, or another factor.
Overclaiming
Avoid conclusions like “light intensity controls photosynthesis completely”. A better conclusion is limited to the data: “Increasing light intensity increased the measured rate of photosynthesis up to 80 arbitrary units.”
Identifying anomalies
An anomaly is a result that does not fit the pattern shown by the rest of the data.
Anomaly
An anomaly is a measurement or result that is noticeably different from the expected trend or from the other repeats collected under the same conditions.
Anomalies can happen because of:
- human error, such as starting a stopwatch late;
- apparatus error, such as an uncalibrated balance;
- biological variation, such as one leaf disc being damaged;
- contamination;
- uncontrolled variables, such as temperature changing during the experiment.
You identify anomalies by comparing a result with:
- other repeats at the same value of the independent variable;
- the overall pattern in a graph;
- expected biological behaviour.
What to do with an anomaly
You should not automatically delete an anomalous result. First, decide whether there is a justified reason to exclude it.
It is more acceptable to exclude a result if:
- it is clearly far from the other repeats;
- there is a known procedural problem;
- keeping it would distort the mean;
- enough repeats remain to calculate a representative mean.
Deciding whether to exclude an anomaly
A student measures oxygen produced by pondweed at one light intensity. The repeats are 18, 19, 20, 5 and 19 bubbles per minute.
-
Compare the values: four repeats are clustered between 18 and 20 bubbles per minute, while 5 bubbles per minute is much lower.
-
Judge whether the low value fits the pattern: 5 bubbles per minute is unlikely to represent the same conditions because it is far outside the cluster of the other repeats.
-
Calculate the mean with the anomaly:
- Calculate the mean without the anomaly:
- Evaluate the effect: including the anomaly lowers the mean from 19.0 to 16.2 bubbles per minute, so it would give a misleading estimate of the rate if the anomaly was caused by error.
Use anomalies carefully
In an exam, say why a value is anomalous. “It is anomalous because it is far lower than the other repeats at the same light intensity” is better than just “it looks wrong”.
Limitations in experimental procedures
A limitation is a weakness in the method that reduces confidence in the results or conclusion.
Limitation
A limitation is a feature of the experimental design, apparatus or procedure that may reduce validity, accuracy, precision or reliability.
Common limitations include:
- too few repeats;
- uncontrolled variables;
- subjective measurements, such as judging colour change by eye;
- apparatus with low resolution;
- narrow range of independent variable values;
- lack of calibration;
- small sample size;
- biological material not standardised, such as leaves of different ages or surface areas.
Validity and reliability
Validity means the experiment measures what it is supposed to measure. For example, counting bubbles from pondweed is a rough measure of photosynthesis rate, but bubble size may vary, so oxygen volume would be a more valid measurement.
Reliability means repeated measurements are consistent. Repeats improve reliability because they reveal variation and help identify anomalies.
Validity and reliability
Validity is the extent to which a method measures the intended variable. Reliability is the extent to which repeated measurements give consistent results.
Evaluating a method limitation
A student investigates the effect of pH on amylase activity by recording the time taken for starch to disappear. They test for starch by placing drops of the reaction mixture onto iodine solution every 30 seconds.
-
Identify what the method measures: the student estimates the time when starch is no longer detected by iodine.
-
Judge the resolution of the time measurement: testing every 30 seconds means the true endpoint could occur at any time within a 30-second interval.
-
Explain the effect on the result: the calculated rate may be imprecise because the recorded endpoint may be up to about 30 seconds later than the actual endpoint.
-
Suggest a direct improvement: test at shorter intervals, such as every 10 seconds, or use a colorimeter to measure the decrease in starch more objectively.
Vague limitations
“Human error” is usually too vague. Name the actual issue, such as “judging the colour change by eye is subjective” or “starting the stopwatch late would affect the measured time”.
Accuracy, precision and uncertainty
These terms are often confused, but they mean different things.
Accuracy
Accuracy is how close a measured value is to the true value.
Precision
Precision is how close repeated measurements are to each other, or how small the measurement intervals are on the apparatus.
A measurement can be precise but not accurate. For example, a balance that is incorrectly zeroed may give repeated readings that are very similar, but all are shifted away from the true mass.
Apparatus uncertainty
Uncertainty is the doubt associated with a measurement. It is often linked to the smallest division on the apparatus.
For many analogue instruments, the uncertainty is usually taken as half the smallest scale division. For many digital instruments, it is often taken as plus or minus the smallest displayed unit.
For example:
- a measuring cylinder marked every 1 cm³ may have an uncertainty of approximately ±0.5 cm³;
- a digital balance reading to 0.01 g may have an uncertainty of ±0.01 g.
Uncertainty
Uncertainty is the range around a measurement within which the true value is expected to lie, based on the measuring apparatus and method.
Margin of error
A margin of error is the possible range of values around a measurement or calculated result. In practical Biology, you may use error bars on graphs to show uncertainty, range, or standard deviation, depending on what the question states.
If a length is measured as 42.0 mm with an uncertainty of ±0.5 mm, the true value is expected to lie between 41.5 mm and 42.5 mm.
Margin of error
A margin of error is the stated amount by which a measured or calculated value may vary, such as 42.0 mm ±0.5 mm.
Percentage error
Percentage error expresses uncertainty as a percentage of the measured value.
percentage error=absolute uncertaintymeasured value×100\text{percentage error} = \frac{\text{absolute uncertainty}}{\text{measured value}} \times 100percentage error=measured valueabsolute uncertainty×100Calculating percentage error
A student measures 25.0 cm³ of enzyme solution using a measuring cylinder with an uncertainty of ±0.5 cm³.
-
Identify the absolute uncertainty and measured value: the uncertainty is 0.5 cm³ and the measured volume is 25.0 cm³.
-
Substitute into the percentage error formula:
- Calculate the value:
- Interpret the result: the uncertainty is small compared with the measured volume, so the volume measurement is relatively precise.
Reducing percentage error
Using a larger measured quantity often reduces percentage error, as long as it is still biologically appropriate. For example, measuring 25.0 cm³ with ±0.5 cm³ uncertainty gives a lower percentage error than measuring 5.0 cm³ with the same apparatus.
Refining experimental design
To refine an experiment means to improve the method so the evidence becomes more valid, accurate, precise or reliable.
Refining experimental design
Refining experimental design means changing the procedure or apparatus to reduce limitations and improve the quality of the data.
Strong improvements are specific. They should name:
- The limitation.
- The change to the method or apparatus.
- How the change improves the data.
For example, instead of saying “use better equipment”, say “use a colorimeter rather than judging colour by eye, because it gives quantitative absorbance readings and reduces subjectivity”.
Common improvement types
You can often improve an investigation by:
- increasing the number of repeats and calculating a mean;
- controlling temperature using a thermostatically controlled water bath;
- using more precise apparatus, such as a pipette instead of a measuring cylinder;
- using a wider range of values for the independent variable;
- using smaller intervals near a key point, such as an enzyme optimum temperature;
- calibrating apparatus before use;
- standardising biological material, such as using leaf discs of the same diameter;
- using a control experiment for comparison.
Suggesting targeted improvements
A student investigates the effect of temperature on lipase activity using phenolphthalein indicator. They place tubes in beakers of water at different temperatures and record the time taken for the pink colour to disappear.
-
Identify a limitation: beakers of water may not keep a constant temperature during the reaction.
-
Link this to data quality: if temperature changes, the independent variable is not properly controlled, reducing validity.
-
Suggest a specific improvement: use a thermostatically controlled water bath and allow solutions to equilibrate before mixing.
-
Explain the benefit: this keeps the reaction mixture closer to the intended temperature, so differences in rate are more likely to be due to temperature rather than uncontrolled variation.
Best improvements are linked
The best improvement is not just “more repeats” or “better apparatus”. It directly fixes a named weakness and explains how the results would improve.
Writing evaluation answers
A clear evaluation answer often follows this structure:
- Judgement — state the issue or strength.
- Evidence — quote data, describe the pattern, or name the method feature.
- Effect — explain how it affects validity, accuracy, precision or reliability.
- Improvement — suggest a specific change, if asked.
For example:
“The conclusion is partly supported because the mean rate increases from 2.1 to 6.8 mm³ min⁻¹ as substrate concentration increases. However, there is an anomalous value at 0.6 mol dm⁻³, and only two repeats were taken, so reliability is limited. Repeating each concentration at least five times and calculating a mean would make the trend more reliable.”
In the exam
-
Use the correct evaluation word: accuracy for closeness to the true value, precision for closeness of repeats or apparatus resolution, validity for measuring the intended variable, and reliability for consistency.
-
When discussing anomalies, compare the anomalous value with the other repeats or the trend; do not remove it without justification.
-
Make improvements specific: name the apparatus or procedural change and explain exactly how it improves the results.
Check yourself
- What is the difference between accuracy and precision?
- How would you decide whether a result is anomalous?
- Why is “use better equipment” usually not enough as an improvement?