What you'll learn
- How to plan a biological investigation using variables, controls, repeats, and clear methods.
- How to work safely by identifying hazards and reducing risk.
- How to record, process, present, and evaluate practical data scientifically.
- How to use equipment, software, research sources, and citations appropriately.
Why practical skills matter
Practical skills are not a separate “extra” topic — they run through the whole OCR A-Level Biology A course. You will use them in the Practical Endorsement, where your teacher observes you carrying out practical work, and in written exam questions that ask you to plan, analyse, or evaluate experiments.
Practical Endorsement
The Practical Endorsement is the teacher-assessed part of A-Level Biology where you demonstrate practical competence across a range of biological techniques. It is reported separately from your exam grade, but the same skills are also tested in written papers.
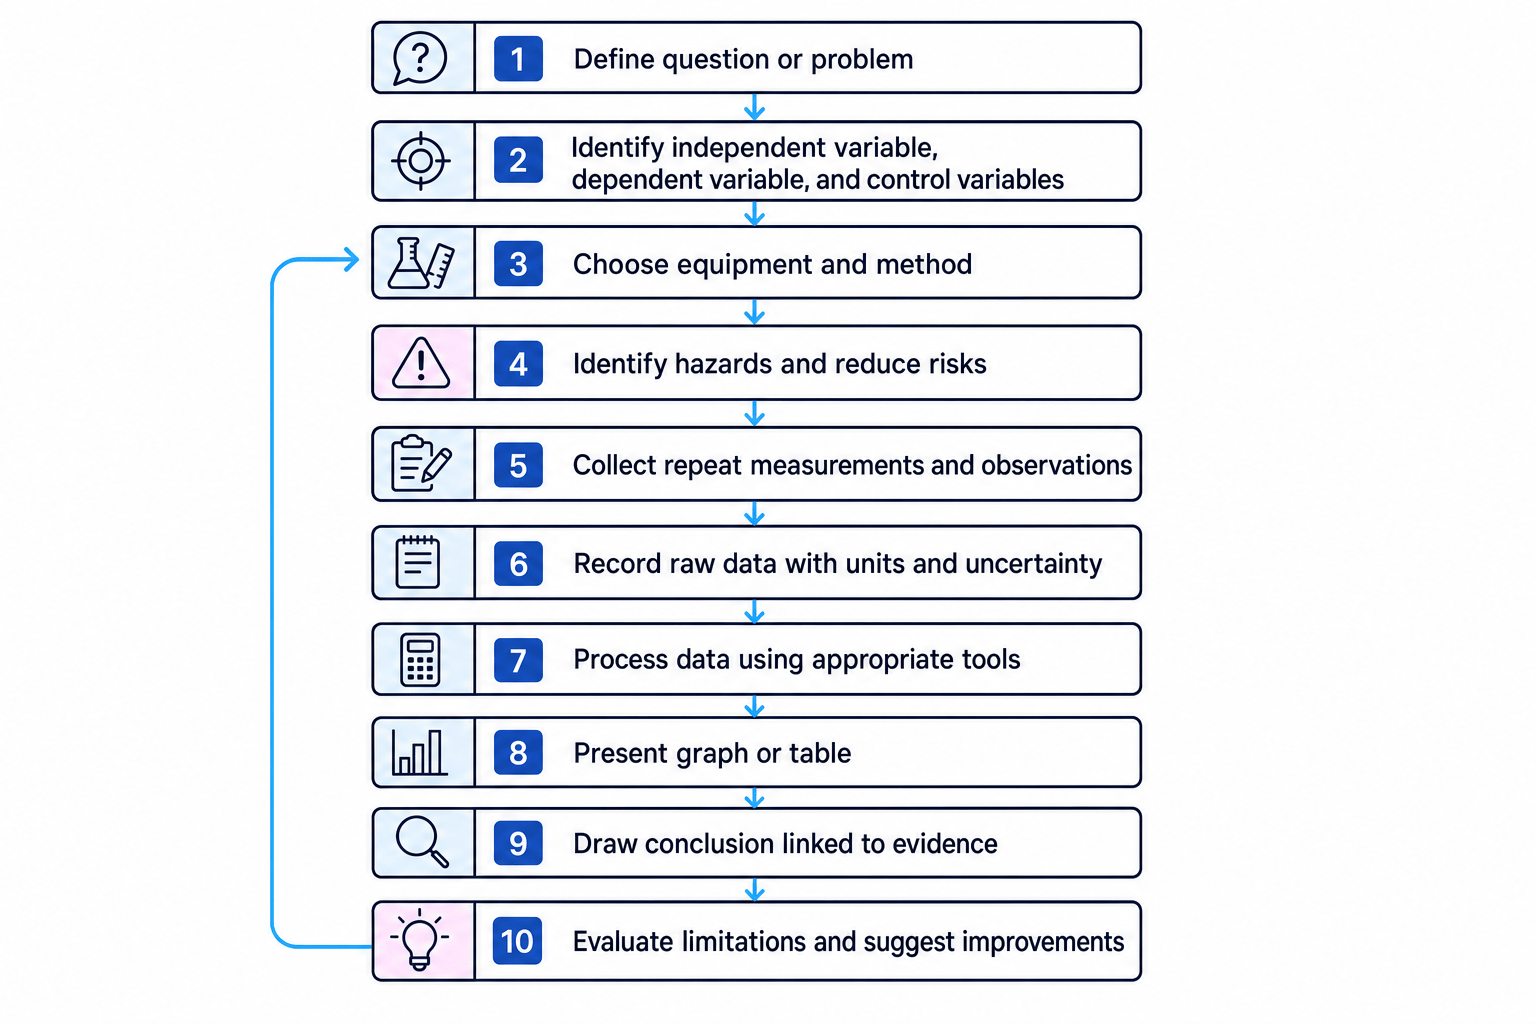
A good practical investigation follows a cycle: plan, work safely, collect data, process it, present it, conclude, and evaluate. If the evaluation shows a weakness, you improve the method and try again.
1. Independent thinking: planning an investigation
Independent thinking means applying scientific methods to a new situation, rather than just copying a familiar practical.
Start by turning a biological idea into a testable question.
For example: “Does temperature affect enzyme activity?” is broad. A more practical question is: “How does temperature affect the rate of amylase breaking down starch?”
Variables
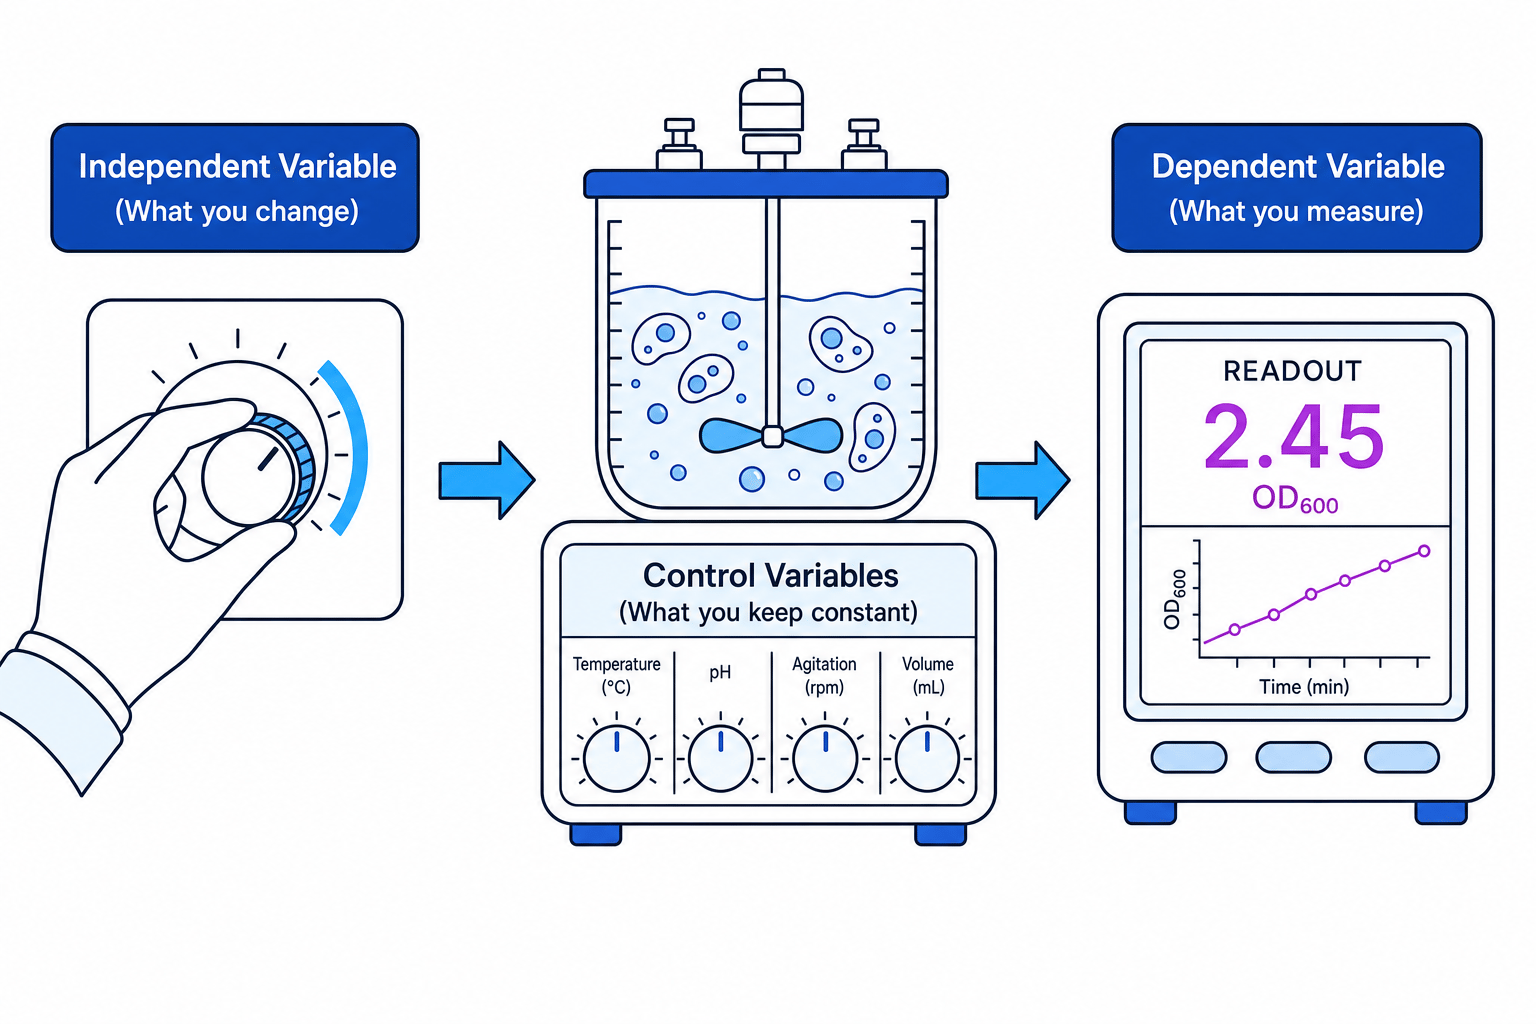
An independent variable is the factor you deliberately change. A dependent variable is the factor you measure. Control variables are factors kept constant so that the test is valid.
A valid investigation tests what it claims to test. If you investigate temperature but accidentally also change pH, enzyme concentration, or starch concentration, your conclusion becomes weaker.
Fair testing
Change only the independent variable, measure the dependent variable, and control other important factors.
Planning an enzyme investigation
You want to investigate the effect of temperature on the rate of amylase activity.
- Choose the independent variable: temperature, for example 10 °C, 20 °C, 30 °C, 40 °C, and 50 °C.
- Choose the dependent variable: time taken for starch to disappear, detected using iodine solution. A shorter time means a faster reaction.
- Identify key control variables: amylase concentration, starch concentration, pH, total volumes, and the method used to decide the end point.
- Decide how to improve reliability: repeat each temperature at least three times and calculate a mean, excluding only justified anomalies.
- Choose a suitable conclusion method: calculate rate using rate=1time\text{rate} = \frac{1}{\text{time}}rate=time1, so higher values directly mean faster enzyme activity.
2. Solving problems in a practical context
Practical work rarely goes perfectly. Independent thinking includes spotting problems and adapting logically.
Common practical problems include:
- no visible result
- readings changing too quickly to measure
- inconsistent repeats
- equipment not sensitive enough
- contamination
- an uncontrolled variable affecting the result
The key is to improve the method without changing the purpose of the investigation.
Improving an unreliable method
In a starch-amylase practical, repeats at 40 °C give times of 42 s, 78 s, and 45 s.
- Compare the readings: 42 s and 45 s are close, but 78 s is much higher, so it may be anomalous.
- Consider practical causes: the enzyme and starch may not have equilibrated to 40 °C before mixing, or the iodine end point may have been judged late.
- Improve the method: place enzyme and starch separately in the water bath for the same set time before mixing, then sample at fixed intervals.
- Repeat the measurement: only exclude 78 s if there is a clear practical reason or repeated evidence that it does not fit the pattern.
Deleting awkward data
Do not remove a result just because it does not support your expected trend. Call it anomalous only if you can justify why it is unlikely to represent the true pattern.
3. Working safely with equipment and materials
Safe practical work starts before you touch the apparatus.
Hazard and risk
A hazard is something that could cause harm, such as a corrosive chemical or hot water bath. Risk is the chance of harm happening, combined with how serious that harm would be.
To minimise risk, you use control measures. These might include wearing eye protection, using low concentrations, keeping cultures sealed, sterilising equipment, using a water bath instead of a naked flame, or disposing of biological material correctly.
You should also use equipment correctly. For example, micropipettes must be set within their allowed volume range; colorimeter cuvettes should be handled by the frosted sides; microscopes should be focused on low power before high power.
Reducing risk in a practical
A student is investigating the effect of disinfectant concentration on bacterial growth using agar plates.
- Identify hazards: bacteria may be pathogenic, disinfectant may irritate skin or eyes, and contaminated agar plates could spread microorganisms.
- Assess the risk: direct contact with bacteria is unlikely if plates remain sealed, but the consequence of contamination could be serious.
- Choose control measures: use aseptic technique, disinfect benches, keep Petri dishes taped but not fully sealed, incubate at a suitable school temperature, and dispose of plates using appropriate sterilisation.
- Check the method: do not open plates after incubation, because this increases exposure to any grown microorganisms.
Safety overrides the method
If a written method seems unsafe, damaged equipment is provided, or a spill occurs, stop and tell your teacher or technician. Do not improvise a risky workaround.
4. Following written instructions
Following written instructions is a practical skill in itself. Methods often contain precise volumes, concentrations, timings, temperatures, and orders of steps.
Before starting, read the whole method so you understand:
- what you are changing
- what you are measuring
- which measurements need units
- where safety precautions are needed
- when timing begins and ends
- what data table you need before collecting results
Before you start
Sketch your results table before the practical begins. It helps you notice missing units, repeats, or time points before it is too late.
5. Making and recording observations and measurements
An observation is something you notice directly, such as a colour change, precipitate, gas bubbles, or movement. A measurement is a numerical value collected using equipment, such as mass in grams, length in millimetres, time in seconds, or absorbance from a colorimeter.
Good measurements are:
- accurate: close to the true value
- precise: repeated readings are close together
- recorded with suitable units
- recorded to a sensible number of decimal places
- accompanied by uncertainty where appropriate
Uncertainty
Uncertainty is the range within which the true value is expected to lie. For example, a balance reading of 2.50 g on a balance with uncertainty ±0.01 g means the true mass is likely to be between 2.49 g and 2.51 g.
Calculating percentage uncertainty
A student measures 2.50 g of glucose using a balance with uncertainty ±0.01 g.
- Use the percentage uncertainty formula:
- Substitute the values with units:
- Calculate and cancel the grams:
- Interpret the result: the measurement has low percentage uncertainty, so the balance is suitable for this mass.
6. Keeping appropriate practical records
Your practical records should be good enough that someone else could understand what you did and what you found.
Include:
- date and title
- aim or question
- method summary, especially any changes from the written method
- equipment and key settings, such as wavelength on a colorimeter
- raw data, not just processed data
- units and uncertainties
- repeats and anomalies
- safety notes if relevant
- conclusion and evaluation
Raw data should not be “tidied up” later. If you make a mistake, cross it out neatly and write the correction. This preserves the reliability of the record.
Only recording processed data
Do not record only means or final graph values. Examiners and teachers need to see the original readings so they can judge reliability and processing.
7. Presenting data scientifically
Scientific presentation makes patterns easier to see and easier to assess.
For tables:
- put the independent variable in the first column
- include units in column headings, not in every cell
- use consistent decimal places for repeated measurements
- keep raw data and processed data clearly separated
For graphs:
- put the independent variable on the x-axis
- put the dependent variable on the y-axis
- label axes with quantity and unit
- choose a sensible scale using most of the graph area
- plot points accurately
- use a line of best fit for continuous data where appropriate
- use bars for categoric data
Choosing the right graph
You investigate how light intensity affects the rate of photosynthesis in pondweed.
- Classify the independent variable: light intensity is continuous because it can take numerical values across a range.
- Classify the dependent variable: rate of photosynthesis is also numerical, such as bubbles per minute or oxygen volume per minute.
- Choose the graph type: a scatter graph or line graph is suitable because both variables are numerical and you are looking for a trend.
- Assign axes: light intensity goes on the x-axis, and rate of photosynthesis goes on the y-axis.
- Decide the line: use a line or curve of best fit rather than joining point-to-point if the data show biological variation.
8. Using software and tools
Software can help you process data, but it does not replace biological judgement.
You may use spreadsheets, graphing software, calculators, data loggers, image analysis tools, online databases, or word-processing software for reports.
Suitable uses include:
- calculating means, rates, ratios, and percentages
- producing graphs
- adding trendlines where appropriate
- calculating standard deviation if required
- using sensors to collect repeated measurements over time
- presenting a report clearly
Always check whether software has done what you intended. For example, a spreadsheet may treat a number as text, use the wrong cells in a formula, or plot a bar chart when a scatter graph is needed.
Spreadsheet sanity check
Calculate one value manually, then compare it with the spreadsheet output. If they match, your formula is more likely to be correct.
9. Researching biological information
Research skills include finding information from reliable sources, both online and offline.
Good sources include textbooks, scientific review articles, reputable scientific organisations, university websites, government health or environmental agencies, and carefully selected journals.
Be more cautious with anonymous websites, adverts, outdated pages, and sources that make claims without evidence.
When researching, ask:
- Who wrote it?
- When was it published or updated?
- Is it relevant to A-Level Biology?
- Does it cite evidence?
- Is there a possible bias?
10. Citing sources correctly
A citation tells the reader where information came from. This matters because it allows your work to be checked and gives credit to the original author.
A useful citation usually includes:
- author or organisation
- year of publication or update
- title
- publisher or website
- URL if online
- date accessed if the webpage may change
For example, a website citation might include the organisation name, year, page title, full URL, and access date. Your school may ask you to follow the method recommended in the Practical Skills Handbook, so keep your format consistent.
Listing only a search engine
Do not cite “Google” as your source. Google helped you find the source; it is not usually the source of the biological information itself.
11. Using instruments, equipment, and techniques
Across the course, you will use a wide range of biological equipment and techniques. The exact set depends on the practical, but you should become confident with apparatus such as:
- light microscopes and slides
- balances
- pipettes, burettes, and measuring cylinders
- thermometers, temperature probes, and water baths
- pH meters and pH buffers
- colorimeters
- data loggers and sensors
- Petri dishes and aseptic equipment
- quadrats and transects
- dissection instruments
- chromatography or electrophoresis equipment where relevant
The skill is not just naming equipment. You need to select equipment that is appropriate for the measurement.
For example, measuring 10.0 cm³ of enzyme solution with a measuring cylinder may be acceptable for a rough preparation, but a pipette is better when precision is important.
Selecting suitable equipment
A student needs to measure 1.00 cm³ of enzyme solution for each repeat in an enzyme practical.
- Compare possible instruments: a beaker is unsuitable because it is not designed for accurate volume measurement.
- Compare a measuring cylinder and pipette: a small measuring cylinder may work, but a pipette or micropipette gives greater precision for 1.00 cm³.
- Consider repeatability: using the same pipette technique each time reduces variation between repeats.
- Choose the equipment: use a 1.00 cm³ pipette or suitable micropipette, depending on what is available and the required precision.
Practical competence
A strong practical biologist can justify choices: why that method, why that equipment, why those controls, and why that conclusion follows from the data.
In the exam
- When asked to plan an investigation, name the independent variable, dependent variable, control variables, repeats, safety precautions, and data-processing method.
- When evaluating data, comment on evidence: spread of repeats, anomalies, uncertainty, sample size, control of variables, and whether the conclusion matches the results.
- When suggesting improvements, be specific: say what you would change, how you would change it, and why it would improve validity, accuracy, precision, or reliability.
Check yourself
- Can you explain the difference between a hazard and a risk using a biology practical example?
- Can you design a simple results table with units and repeats before collecting data?
- Can you justify why a particular graph type or piece of equipment is suitable for a given investigation?