What you'll learn
- The three levels of biodiversity: habitat, species and genetic.
- How field sampling is used to estimate biodiversity in real habitats.
- How to calculate and interpret Simpson’s Index of Diversity and genetic diversity.
- Why biodiversity matters, what threatens it, and how conservation protects it.
What biodiversity means
Biodiversity
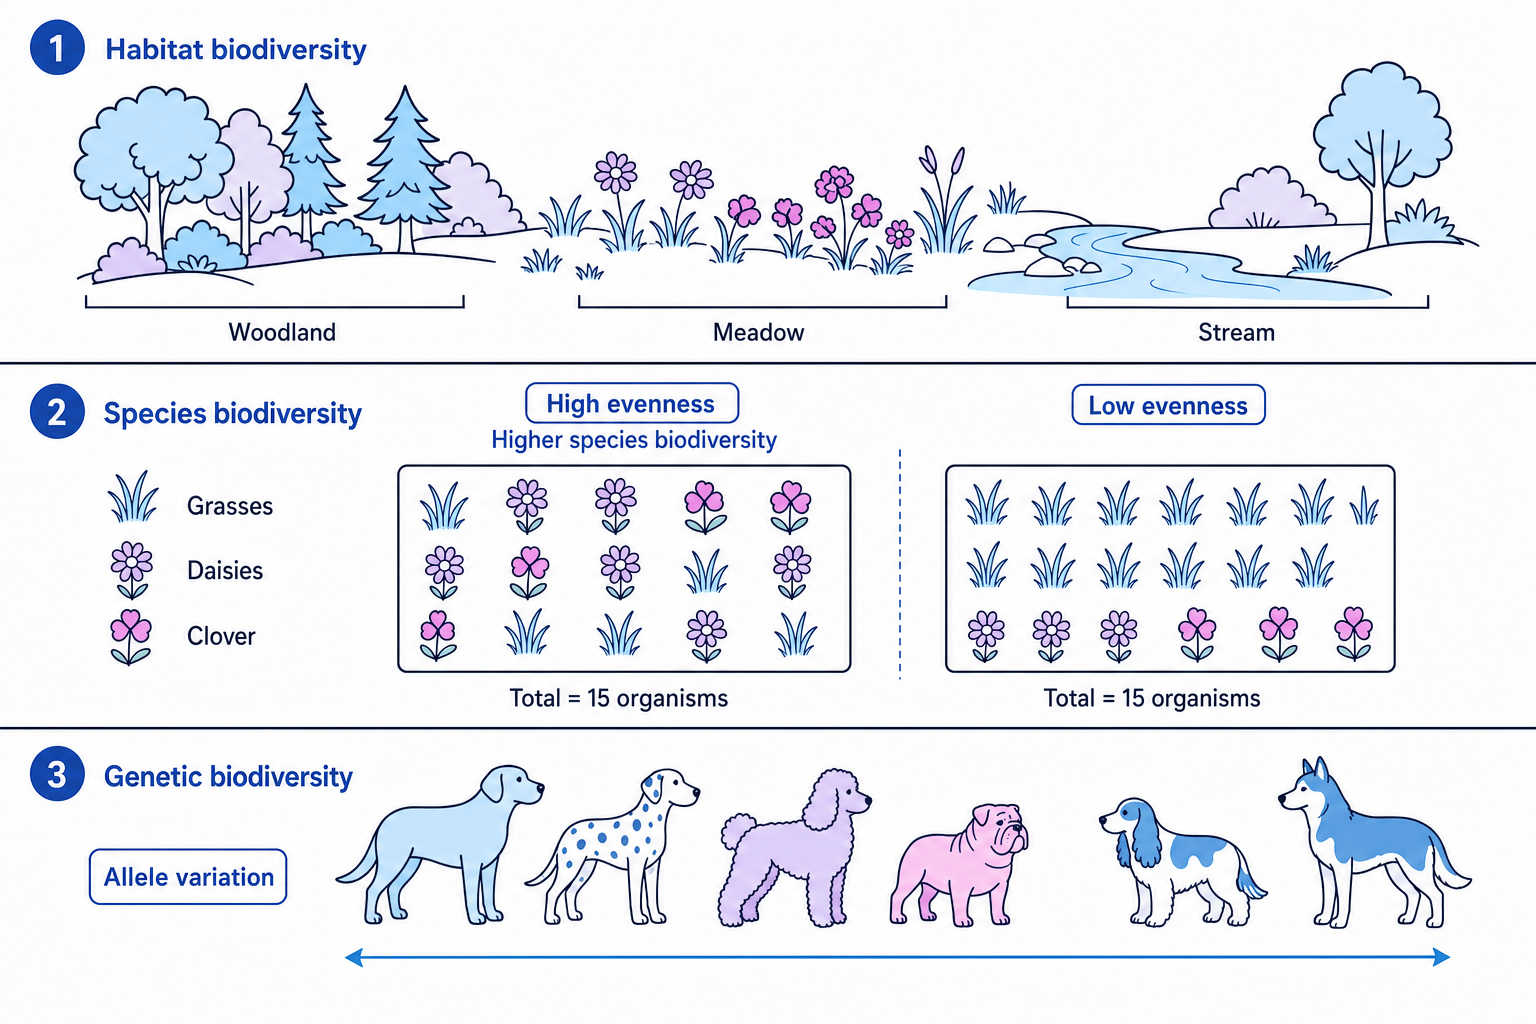
Biodiversity is the variety and complexity of life in an area. It can be considered at the level of habitats, species or genes.
A habitat is the place where an organism lives, including the physical conditions and other organisms found there. Biodiversity is useful because it gives an indication of how complex, stable and resilient a habitat may be.
Habitat biodiversity
Habitat biodiversity is the variety of different habitats in an area. For OCR, you should be comfortable with examples such as sand dunes, woodland, meadows and streams.
An area containing woodland, meadow and a stream has higher habitat biodiversity than an area containing only a single large field.
Species biodiversity
A species is a group of organisms that can interbreed to produce fertile offspring. Species biodiversity is the variety of species in a habitat.
It has two main components:
- Species richness: the number of different species present.
- Species evenness: how evenly individuals are distributed between those species.
Genetic biodiversity
A gene is a length of DNA that codes for a polypeptide or functional RNA. An allele is a different version of a gene.
Genetic biodiversity is the variety of alleles within a species or population. Different breeds within one species, such as different cattle breeds or dog breeds, show genetic biodiversity.
Three levels
Biodiversity is not just “number of species”. OCR expects you to recognise biodiversity at the level of habitats, species and genes.
Species richness and species evenness
Species richness is simple to count: if a meadow contains grasses, daisies, buttercups and clover, its species richness is 4.
Species evenness needs a little more judgement. A habitat where each species has similar abundance has high evenness. A habitat dominated by one species has low evenness, even if several species are present.
Comparing richness and evenness
Two grassland samples each contain 30 organisms.
- In sample A, there are 10 grasses, 10 daisies and 10 clovers, so the species richness is 3.
- In sample B, there are 28 grasses, 1 daisy and 1 clover, so the species richness is also 3.
- Sample A has higher species evenness because individuals are distributed equally between the species, so it has higher species biodiversity.
Richness alone is not enough
Do not say a habitat has high biodiversity just because it has high species richness. If one species dominates and the others are rare, species evenness is low.
Sampling biodiversity in a habitat
Sampling
Sampling means collecting data from a small, representative part of a habitat so that you can estimate what is present in the whole habitat.
Sampling is important because it is usually impossible to count every organism in a habitat. Good sampling reduces bias, allows habitats to be compared and helps you collect data from the full range of organisms and microhabitats present.
Random sampling
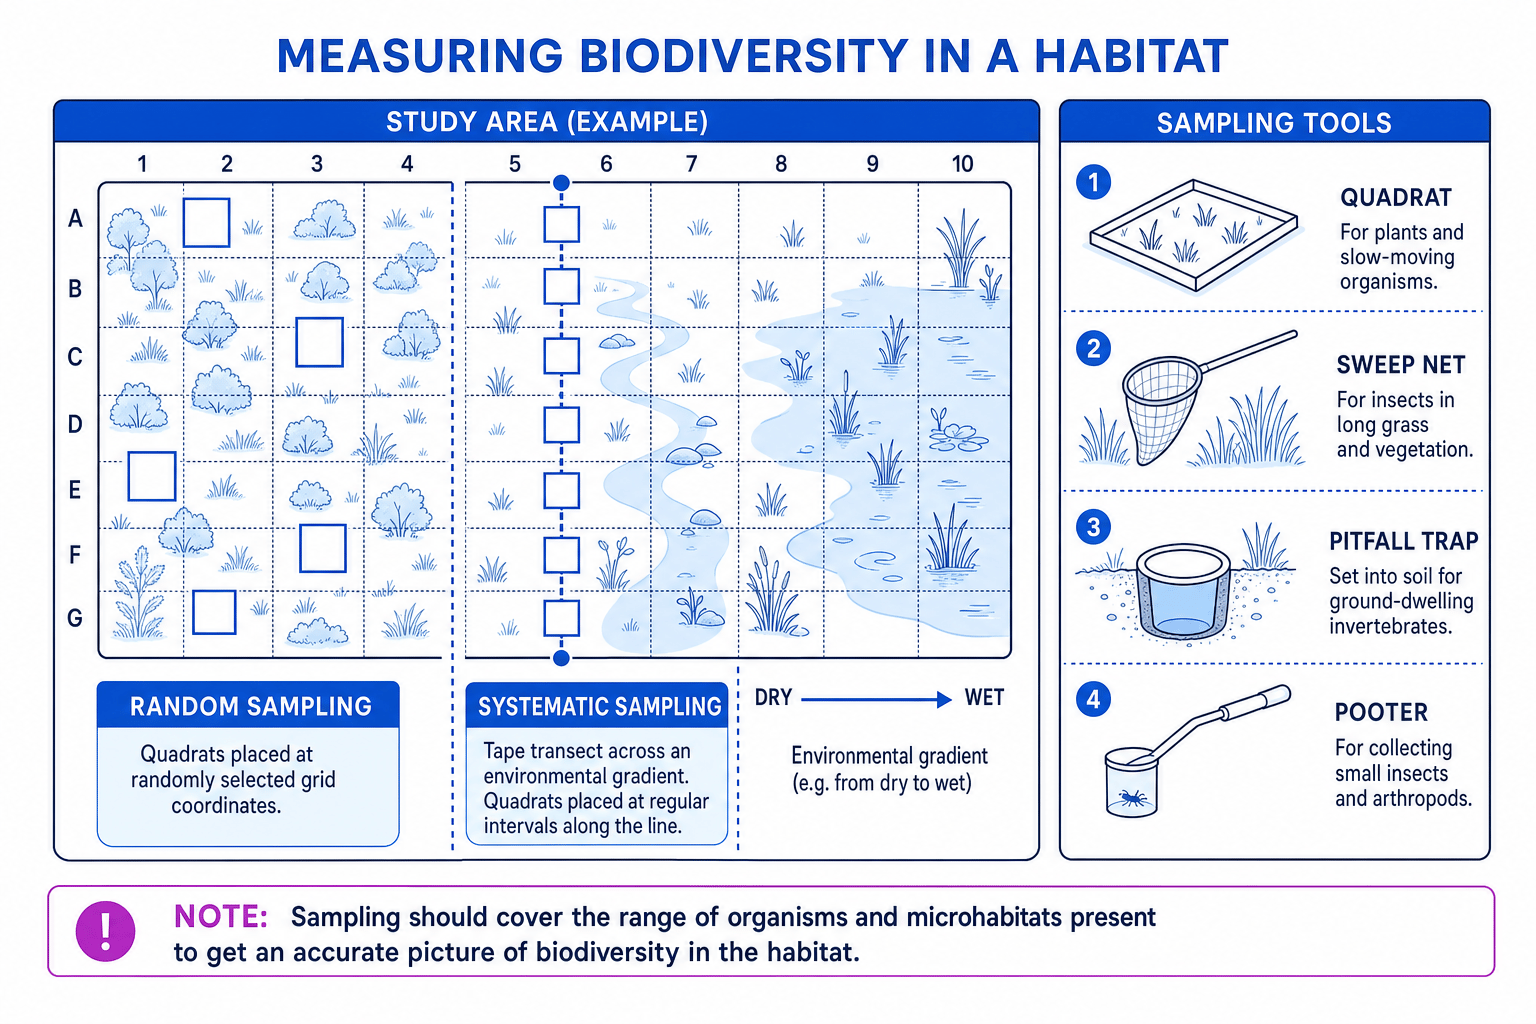
In random sampling, every part of the study area has an equal chance of being sampled.
A typical method is:
- Lay out a grid over the study area.
- Use random numbers to generate coordinates.
- Place a quadrat at each coordinate.
- Record the organisms inside the quadrat.
- Repeat many times, then calculate means or percentages.
A quadrat is a square frame of known area, often used for plants or slow-moving organisms. You might record abundance, percentage cover or presence/absence.
Estimating abundance using quadrats
A 200 m² meadow is sampled using 20 random quadrats. Each quadrat has an area of 0.25 m². A total of 150 daisies is counted.
- Calculate the total sampled area: 20×0.25 m2=5.0 m220 \times 0.25\ \text{m}^2 = 5.0\ \text{m}^220×0.25 m2=5.0 m2.
- Calculate the mean density of daisies: 150 plants5.0 m2=30 plants m−2\frac{150\ \text{plants}}{5.0\ \text{m}^2} = 30\ \text{plants m}^{-2}5.0 m2150 plants=30 plants m−2.
- Estimate the total population in the meadow: 30 plants m−2×200 m2=6000 plants30\ \text{plants m}^{-2} \times 200\ \text{m}^2 = 6000\ \text{plants}30 plants m−2×200 m2=6000 plants.
Non-random sampling
In non-random sampling, the positions sampled are chosen deliberately. This can be useful, but it may introduce bias if not planned carefully.
- Opportunistic sampling: sampling organisms that are easiest to find. It is quick, but often biased.
- Stratified sampling: dividing a habitat into different zones, then sampling each zone. For example, woodland edge and open meadow could be sampled separately.
- Systematic sampling: sampling at regular intervals, often along a transect, which is a line placed across a habitat.
Systematic sampling is especially useful when there is an environmental gradient, such as moving from dry sand dunes towards wetter ground near a stream.
Fieldwork techniques
Different organisms require different sampling methods.
- Quadrats: plants and slow-moving animals.
- Sweep nets: insects in long grass or vegetation.
- Pitfall traps: ground-dwelling invertebrates; the trap is sunk into the soil so organisms fall in.
- Pooters: small insects or arthropods; suction draws the organism into a container, with a filter to prevent inhalation.
Make sampling valid
Standardise your sampling effort: use the same quadrat size, same sweep-net time, same pitfall-trap duration and similar weather conditions where possible.
Simpson’s Index of Diversity
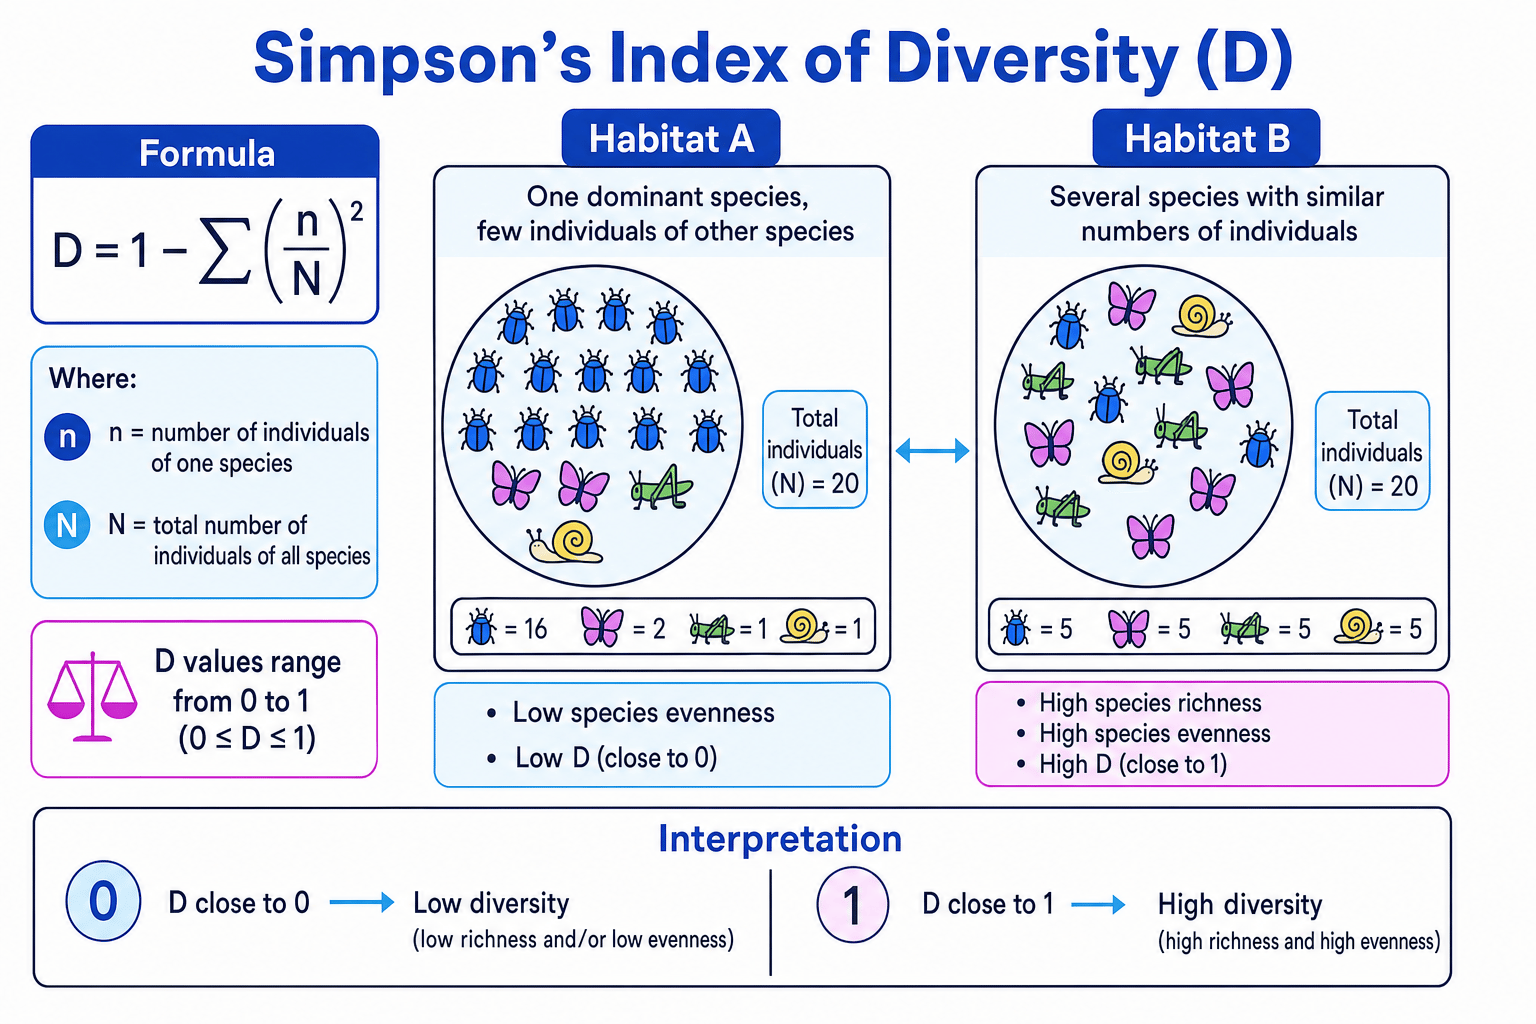
Simpson’s Index of Diversity, represented by DDD, uses both species richness and species evenness. OCR will provide the formula when needed, but you must know how to use and interpret it.
D=1−∑(nN)2D = 1 - \sum \left(\frac{n}{N}\right)^2D=1−∑(Nn)2Here, nnn is the number of individuals of one species, and NNN is the total number of individuals of all species. DDD has no units because it is based on proportions.
- A value of DDD close to 0 indicates low biodiversity.
- A value of DDD close to 1 indicates high biodiversity.
Calculating Simpson’s Index of Diversity
A sample contains 40 individuals of species A, 30 of species B, 20 of species C and 10 of species D.
- Calculate the total number of organisms: N=40+30+20+10=100N = 40 + 30 + 20 + 10 = 100N=40+30+20+10=100 individuals.
- Substitute each species count into the formula: D=1−[(40100)2+(30100)2+(20100)2+(10100)2]D = 1 - \left[\left(\frac{40}{100}\right)^2 + \left(\frac{30}{100}\right)^2 + \left(\frac{20}{100}\right)^2 + \left(\frac{10}{100}\right)^2\right]D=1−[(10040)2+(10030)2+(10020)2+(10010)2].
- Square each proportion and add them: 0.16+0.09+0.04+0.01=0.300.16 + 0.09 + 0.04 + 0.01 = 0.300.16+0.09+0.04+0.01=0.30.
- Calculate the index: D=1−0.30=0.70D = 1 - 0.30 = 0.70D=1−0.30=0.70.
- Interpret the result: 0.70 suggests fairly high biodiversity, because individuals are spread across several species rather than being almost entirely one species.
Genetic biodiversity calculations
Genetic biodiversity can be assessed by looking at how many gene loci are polymorphic.
A locus is the position of a gene on a chromosome. A polymorphic gene locus is a locus where more than one allele is present in the population.
proportion of polymorphic gene loci=number of polymorphic gene locitotal number of loci\text{proportion of polymorphic gene loci} = \frac{\text{number of polymorphic gene loci}}{\text{total number of loci}}proportion of polymorphic gene loci=total number of locinumber of polymorphic gene lociTo convert the proportion to a percentage, multiply by 100.
This is useful for studying isolated populations, such as zoo populations used in captive breeding, rare breeds and pedigree animals. Low genetic biodiversity can increase inbreeding and reduce the population’s ability to adapt to disease or environmental change.
Calculating genetic diversity
A rare breed population is tested at 250 gene loci. Of these, 75 loci are polymorphic.
- Substitute into the formula: 75250=0.300\frac{75}{250} = 0.30025075=0.300.
- Convert to a percentage: 0.300×100=30.0%0.300 \times 100 = 30.0\%0.300×100=30.0%.
- Interpret the result: 30.0% of the loci tested are polymorphic, so this gives a measure of genetic biodiversity within the population.
Factors affecting biodiversity
Human population growth
As the human population increases, more land is needed for housing, transport, food production and industry. This can lead to habitat destruction, habitat fragmentation, pollution and overexploitation of resources.
Agriculture and monoculture
A monoculture is the growth of a single crop species over a large area. Monocultures reduce habitat variety and often reduce species richness.
Agriculture may lower biodiversity by:
- Removing hedgerows, woodland and wildflower margins.
- Using pesticides, which kill insect species.
- Using herbicides, which reduce plant diversity.
- Using fertilisers, which can cause nutrient enrichment and affect aquatic habitats.
- Replacing diverse habitats with a single crop species.
Climate change
Climate change can alter temperature, rainfall and seasonal patterns. Species may shift their distribution, breeding times may become mismatched with food availability, and some habitats may be lost or degraded.
Biodiversity changes over time
Biodiversity is affected by both natural factors and human activity, but current major threats include human population growth, monoculture farming and climate change.
Why maintain biodiversity?
Ecological reasons
A keystone species is a species that has a disproportionately large effect on its ecosystem. If it is removed, many other species may be affected because organisms are interdependent through food webs, pollination, seed dispersal and habitat formation.
Maintaining biodiversity also preserves a genetic resource: alleles that may be useful in the future, such as disease resistance in crops or livestock.
Economic reasons
Biodiversity supports ecosystem services such as pollination, soil formation, water purification and fisheries. In agriculture, maintaining soil organisms and plant diversity can reduce soil depletion compared with continuous monoculture.
Biodiverse habitats can also support tourism, recreation and sustainable harvesting.
Aesthetic reasons
Many people value biodiversity because landscapes, species and natural habitats are beautiful, culturally important and enjoyable to experience. Protecting landscapes is therefore also an aesthetic reason for conservation.
Maintaining biodiversity: in situ and ex situ conservation
In situ conservation protects species in their natural habitat. Examples include marine conservation zones and wildlife reserves.
Ex situ conservation protects species outside their natural habitat. Examples include seed banks, botanic gardens and zoos.
| Method | Where it happens | Examples | Strengths | Limitations |
|---|---|---|---|---|
| In situ | Natural habitat | Marine conservation zones, wildlife reserves | Protects whole ecosystems and species interactions | Threats such as poaching, climate change or disease may still occur |
| Ex situ | Outside natural habitat | Seed banks, botanic gardens, zoos | Useful when a species is at immediate risk in the wild | Can be expensive; populations may have limited genetic diversity |
In situ versus ex situ
In situ conservation protects the habitat and the species together. Ex situ conservation is often a backup strategy when wild populations are very small or threatened.
Conservation agreements
Conservation often needs cooperation at local, national and international levels.
- CITES is the Convention on International Trade in Endangered Species. It controls or bans international trade in endangered species and products made from them.
- The Rio Convention on Biological Diversity, often called the CBD, is an international agreement aiming to conserve biodiversity, use it sustainably and share benefits from genetic resources fairly.
- The Countryside Stewardship Scheme, or CSS, is a UK scheme that supports land management practices that benefit wildlife, habitats and landscapes, such as maintaining hedgerows, field margins and ponds.
These agreements show that conservation is not only biological. It also involves economics, politics, land use and decisions about how humans interact with ecosystems.
In the exam
- When asked about biodiversity, state the level clearly: habitat, species or genetic.
- For Simpson’s Index, show substitution into D=1−∑(nN)2D = 1 - \sum \left(\frac{n}{N}\right)^2D=1−∑(Nn)2, then interpret whether the value is high or low.
- For sampling questions, mention representativeness, reduced bias, repeat sampling and standardising the method.
Check yourself
- How are species richness and species evenness different?
- Why might a monoculture have low biodiversity even if crop yield is high?
- What is one advantage and one limitation of ex situ conservation?