

What you'll learn
- Why biologists classify organisms and what a species is.
- How the taxonomic hierarchy works, from domain to species.
- How DNA, RNA and protein sequences are used in molecular phylogeny.
- How to interpret simple phylogenetic trees without falling into common traps.
Why classify living organisms?
There are millions of described species on Earth, and many more are still undiscovered. Classification gives biologists a shared system for organising this variety of life, communicating clearly, and making predictions about organisms based on their relatives.
For example, if a newly discovered plant is classified in the same family as a known medicinal plant, scientists might investigate whether it makes similar useful chemicals.
Classification, taxonomy and taxa
Classification means arranging organisms into groups based on shared features. Taxonomy is the science of naming and classifying organisms. A taxon is any named classification group, such as a class, family or genus.
The species concept
The basic unit of classification is the species.
Species
A species is a group of organisms with similar characteristics that can interbreed to produce fertile offspring.
“Fertile offspring” means the offspring can also reproduce. For example, horses and donkeys can mate to produce mules, but mules are usually infertile, so horses and donkeys are treated as different species.
Species concept limitations
The biological species definition is harder to apply to fossils, asexually reproducing organisms, and some organisms that form hybrids. In these cases, scientists may also use morphology, genetics and ecological evidence.
The taxonomic hierarchy
Classification is hierarchical: large groups are split into smaller and more specific groups. The usual order is:
Domain → Kingdom → Phylum → Class → Order → Family → Genus → Species
The diagram below shows how one organism, the human, fits into increasingly specific taxa.
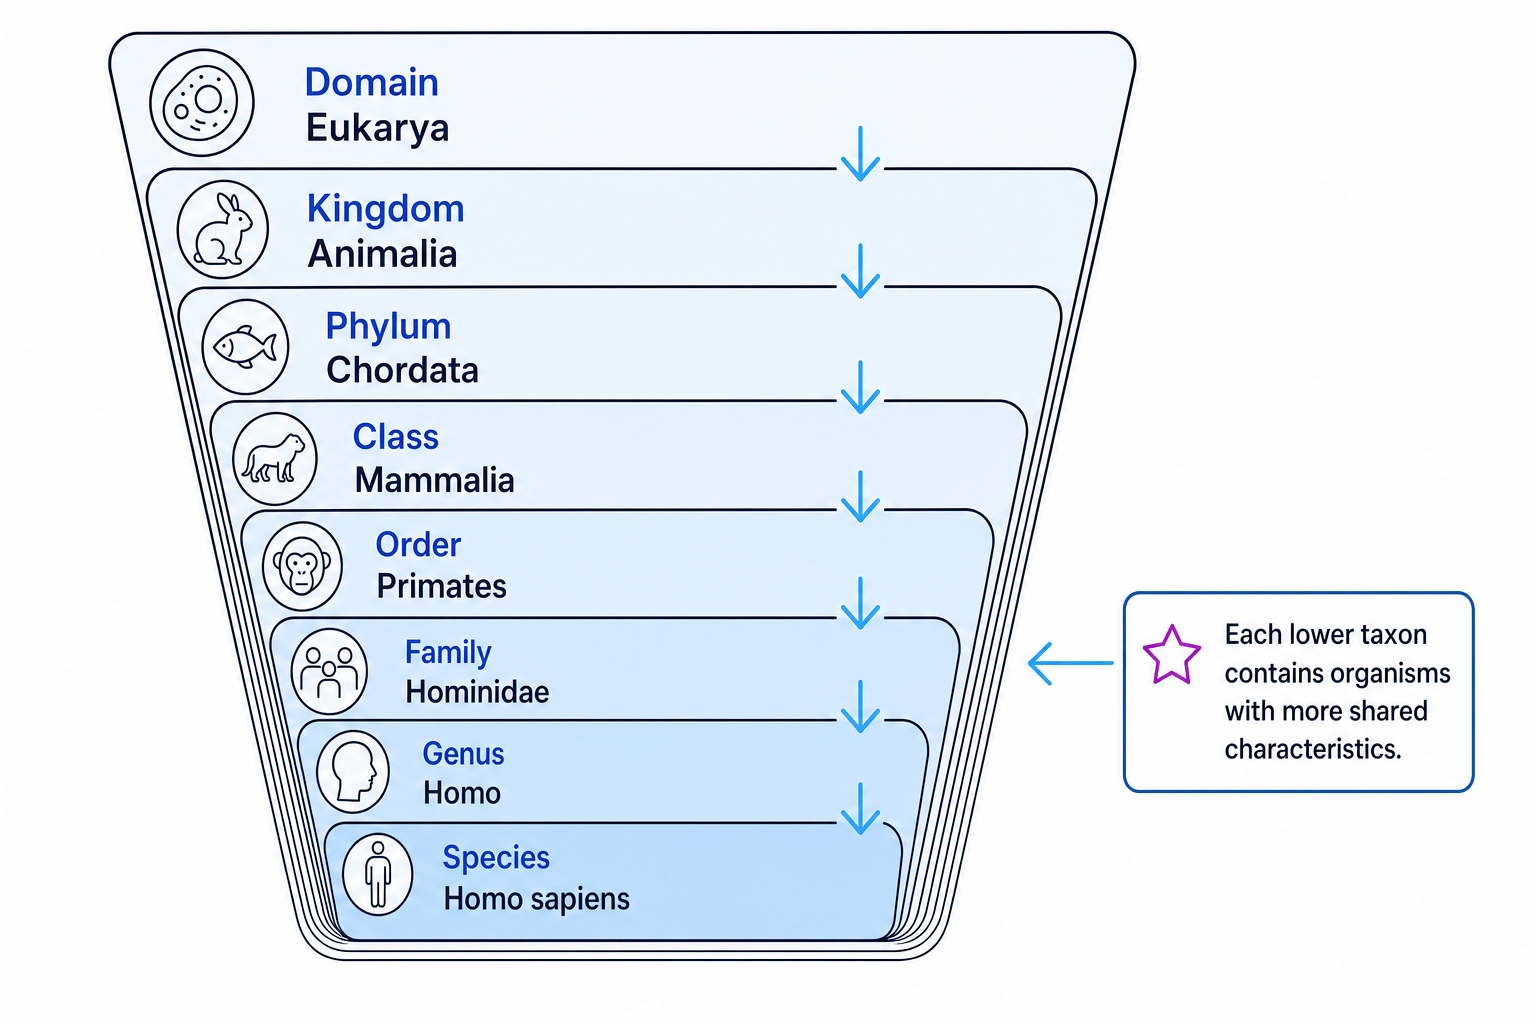
More specific groups share more features
Organisms in the same genus are more closely related, and share more characteristics, than organisms that are only in the same family, order or class.
A useful way to remember the hierarchy is: Dear King Philip Came Over For Good Soup.
Hierarchy sanity check
If two organisms share a lower-level taxon, such as genus, they must also share all the broader taxa above it, such as family, order and class.
Binomial naming
Each species is given a two-part scientific name using the binomial system.
Binomial name
A binomial name contains the organism’s genus followed by its species, for example Homo sapiens.
The genus starts with a capital letter, the species name starts with a lower-case letter, and the whole name is written in italics when typed. If handwriting, underline it instead.
For example:
- Human: Homo sapiens
- Domestic cat: Felis catus
- The bacterium often used in genetic engineering: Escherichia coli
Capitalising the species name
Do not write Homo Sapiens. The genus is capitalised, but the species part is lower-case: Homo sapiens.
Natural and phylogenetic classification
Early classification systems often used obvious features, such as body shape, colour or habitat. These can be useful, but they can also be misleading because unrelated organisms may evolve similar features.
For example, sharks and dolphins both have streamlined bodies because both are adapted for swimming, but dolphins are mammals and sharks are fish. This is an example of convergent evolution, where similar selection pressures lead to similar adaptations in unrelated groups.
Phylogeny
Phylogeny is the evolutionary history of a group of organisms. A phylogenetic classification groups organisms according to evolutionary relationships and common ancestry.
A clade is a group containing a common ancestor and all of its descendants. Modern classification aims to reflect clades rather than just superficial similarities.
The three-domain system
Molecular evidence, especially comparisons of ribosomal RNA, led to the three-domain system. A domain is the highest taxonomic rank, above kingdom.
| Domain | Cell type | Key features |
|---|---|---|
| Bacteria | Prokaryotic | No nucleus; circular DNA; cell walls contain peptidoglycan; 70S ribosomes |
| Archaea | Prokaryotic | No nucleus; no peptidoglycan in cell walls; many genes and protein-synthesis processes are more similar to eukaryotes |
| Eukarya | Eukaryotic | Nucleus present; membrane-bound organelles; linear chromosomes; 80S ribosomes in cytoplasm |
Archaea were once grouped with bacteria because both are prokaryotic. Molecular data showed that archaea are a separate domain.
Calling archaea bacteria
Archaea are prokaryotes, but they are not bacteria. The three domains are Bacteria, Archaea and Eukarya.
Molecular phylogeny
Molecular phylogeny uses molecular evidence, such as DNA base sequences, RNA sequences or amino acid sequences, to infer evolutionary relationships.
The logic is simple: closely related organisms usually have more similar sequences because they have had less time to accumulate mutations since sharing a common ancestor.
Homologous sequence
A homologous sequence is a DNA, RNA or protein sequence in different organisms that has been inherited from a common ancestor.
A typical molecular phylogeny method is:
- Choose the same homologous gene, RNA molecule or protein in each organism.
- Determine the sequence.
- Align the sequences so corresponding bases or amino acids are compared.
- Count similarities and differences.
- Use the pattern of differences to infer which organisms share the most recent common ancestors.
For a simple comparison, percentage similarity can be calculated using:
percentage similarity=number of matching positionstotal positions compared×100\text{percentage similarity}=\frac{\text{number of matching positions}}{\text{total positions compared}}\times 100percentage similarity=total positions comparednumber of matching positions×100Using sequence data to choose closest relatives
-
Compare the same aligned 12-base DNA fragment from three species: species A is
ATGCCATTGACC, species B isATGCTATTGACC, and species C isATGTTATCGACT. -
Compare A with B position by position. They differ at only one base, so they match at 11 out of 12 positions. Their percentage similarity is 1112×100=91.7%\frac{11}{12}\times 100=91.7\%1211×100=91.7%.
-
Compare A with C. They differ at four bases, so they match at 8 out of 12 positions. Their percentage similarity is 812×100=66.7%\frac{8}{12}\times 100=66.7\%128×100=66.7%.
-
Compare B with C. They differ at three bases, so they match at 9 out of 12 positions. Their percentage similarity is 912×100=75.0%\frac{9}{12}\times 100=75.0\%129×100=75.0%.
-
Species A and B are inferred to be the closest relatives because they have the highest sequence similarity and the fewest base differences.
Sequence comparisons must be fair
You must compare homologous sequences from the same gene or protein region. Comparing unrelated genes, or different parts of a gene, would not give valid evidence of relatedness.
Phylogenetic trees
A phylogenetic tree is a branching diagram showing inferred evolutionary relationships. Branch points represent common ancestors, and the tips usually represent present-day species or groups.
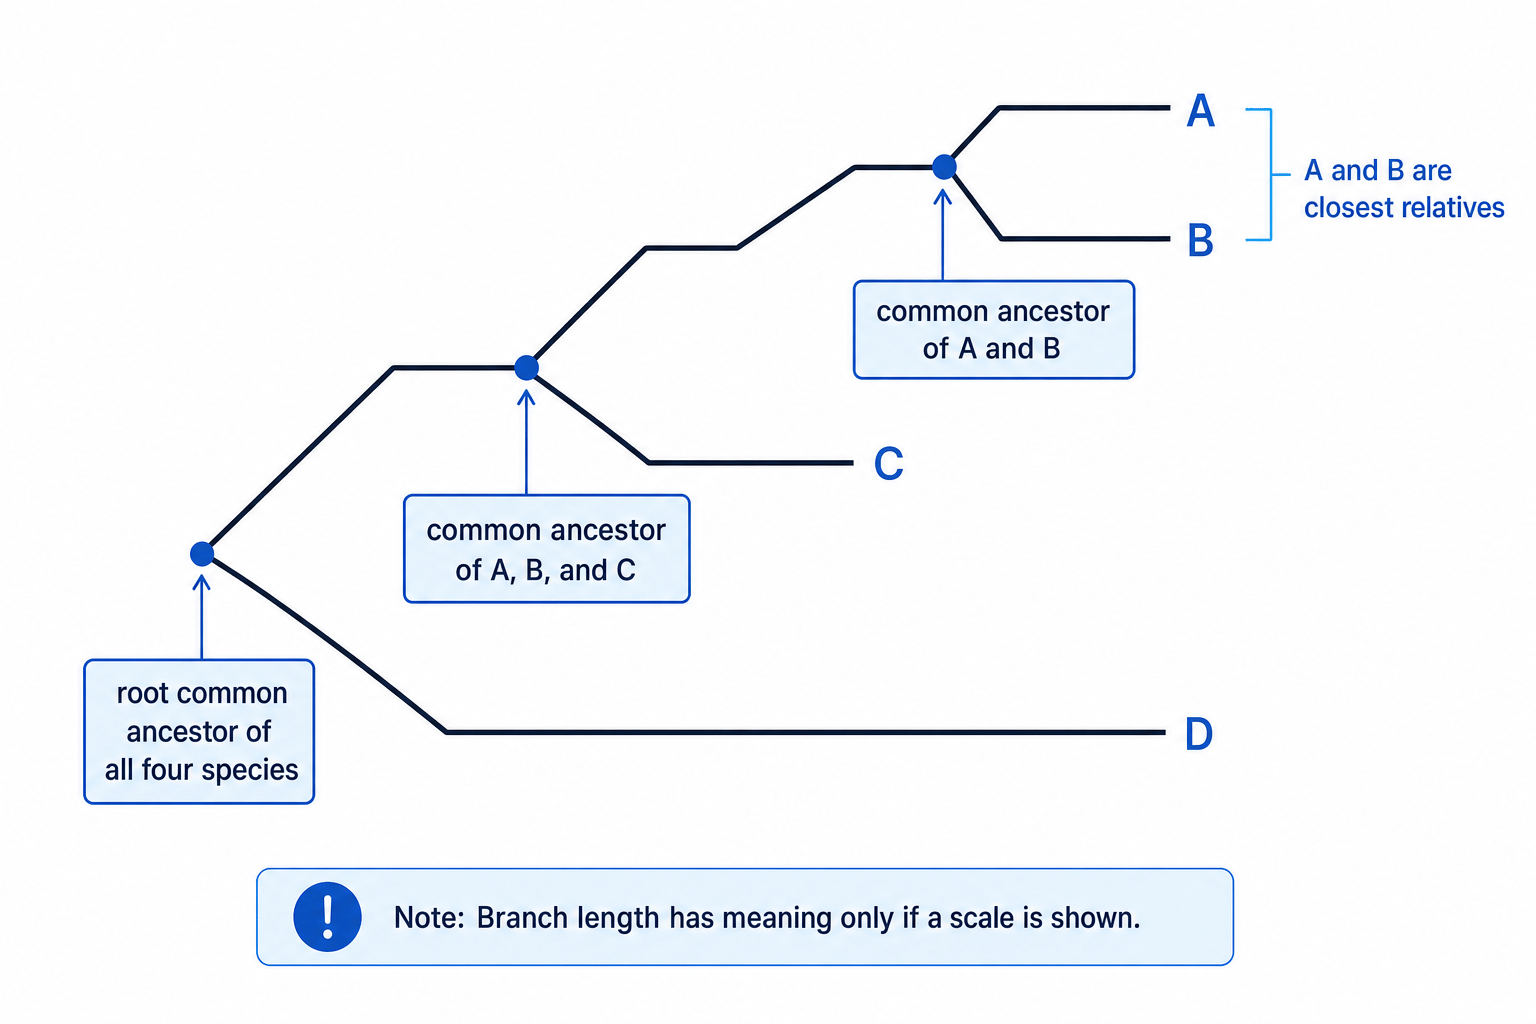
In a tree, the key question is not “which species are drawn next to each other?” but “which species share the most recent common ancestor?”
If a branch length has a scale, it may represent time or amount of genetic change. If there is no scale, do not assume a longer drawn branch means “more evolved” or “older”.
Reading a phylogenetic tree
-
Identify the most recent common ancestor of A and B. They meet at the nearest branch point before either lineage reaches the tips, so A and B are sister taxa.
-
Compare C with A and B. C joins their lineage at an earlier branch point, so C is related to both A and B, but less closely than A and B are to each other.
-
Compare D with the others. D branches from the root before C, A and B split, so D is the most distantly related of the four.
-
Check whether branch lengths are scaled. If no scale is shown, you can infer relatedness from branching order, but not exact divergence times.
Reading across the tips
Do not decide relatedness just from the order of names across the page. Branches can rotate around a node without changing the evolutionary relationships.
Why molecular evidence is powerful
Molecular data can reveal relationships that are not obvious from appearance. It is especially useful when organisms have few visible features, when fossils are incomplete, or when convergent evolution has made unrelated organisms look similar.
Using several genes or proteins gives stronger evidence than using one sequence alone. If multiple independent molecules suggest the same relationship, scientists can be more confident in the phylogeny.
In the exam
-
Use precise terms: species, taxon, genus, domain, common ancestor and molecular sequence.
-
For sequence comparisons, state that more similarities or fewer differences suggest a more recent common ancestor.
-
For phylogenetic trees, use branch points to judge relatedness; do not rely on the left-to-right order of the labels.
Check yourself
- What is the correct order of the taxonomic hierarchy from domain to species?
- Why did molecular evidence lead scientists to separate archaea from bacteria?
- On a phylogenetic tree, how do you identify the two most closely related species?
