What you'll learn
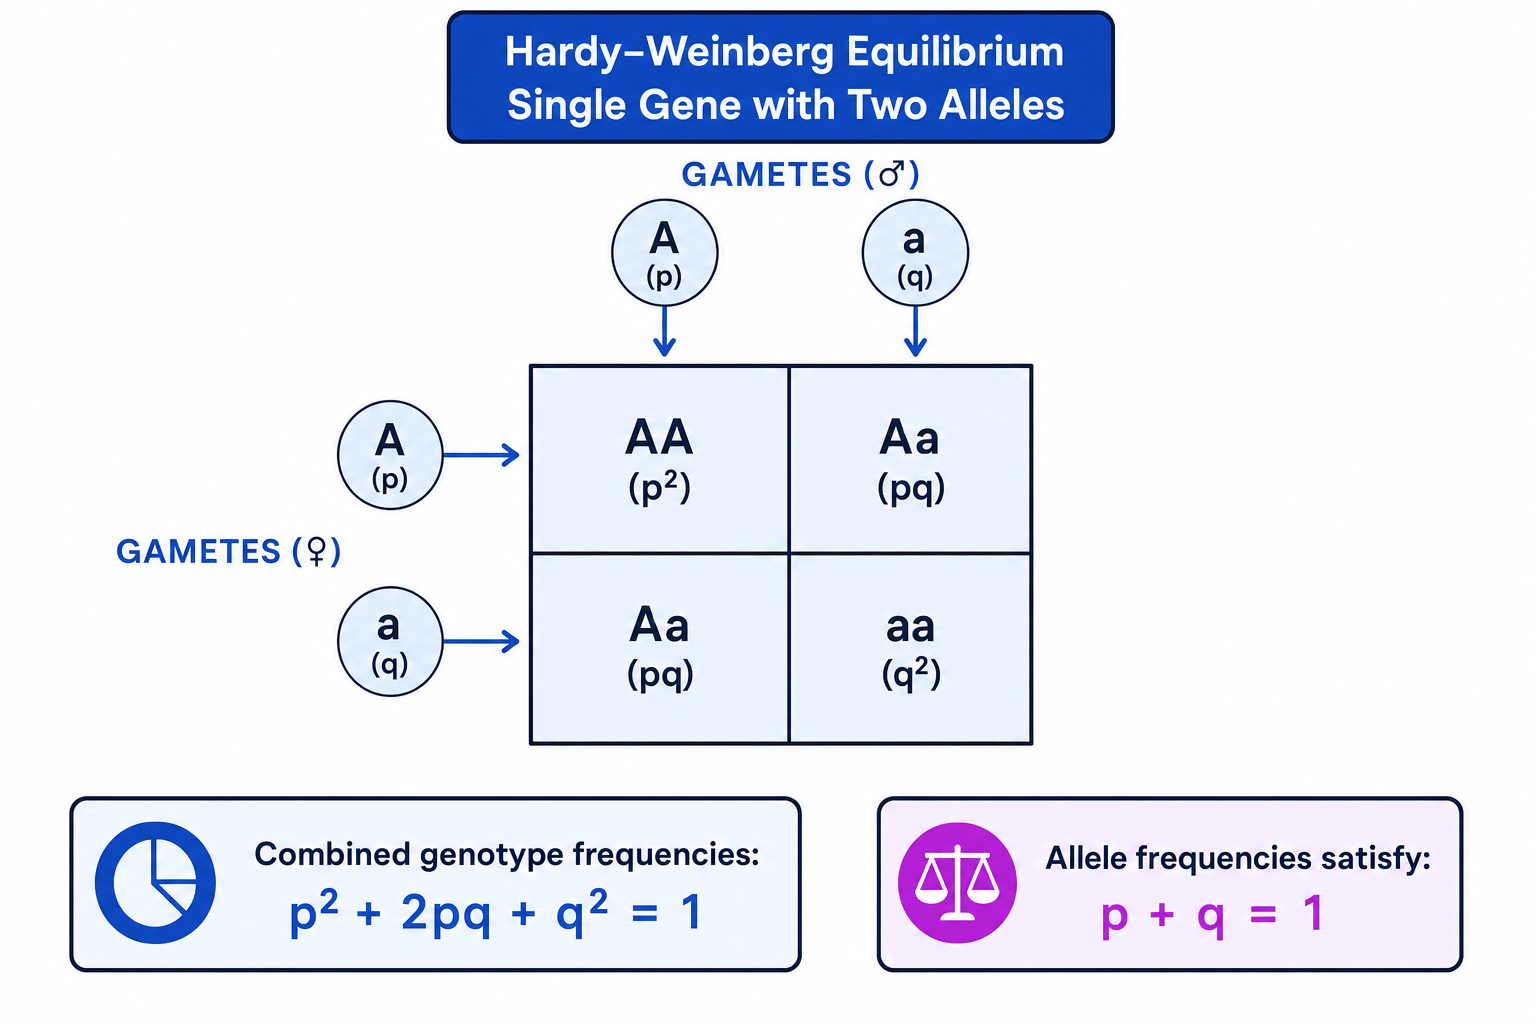
- How allele frequencies and genotype frequencies are linked by the Hardy-Weinberg principle.
- How to calculate frequencies of carriers and affected individuals using ppp and qqq.
- Why populations may stop fitting Hardy-Weinberg predictions.
- How isolation can lead to speciation over many generations.
Starting point: populations, genes and alleles
A species is a group of organisms that can interbreed to produce fertile offspring. Within a species, a population is a group of organisms of the same species living in the same area at the same time.
A gene is a length of DNA that codes for a polypeptide or functional RNA. Different versions of the same gene are called alleles. The position of a gene on a chromosome is its locus.
An organism’s genotype is the alleles it has for a gene, such as AA, Aa or aa. Its phenotype is the observable characteristic, produced by the interaction between genotype and environment.
Gene pool
The gene pool is the total collection of alleles of all genes in a population at a particular time.
For Hardy-Weinberg calculations, we usually focus on one gene with two alleles. The allele frequency is the proportion of all alleles at that locus that are a particular allele. Frequencies have no units and range from 0 to 1.
Calculating allele frequency from genotype counts
A sample of 100 diploid animals contains 40 AA, 50 Aa and 10 aa individuals.
-
Each diploid individual has two alleles at the gene locus, so the total number of alleles is 2×100=2002 \times 100 = 2002×100=200 alleles.
-
Count the A alleles: each AA individual contributes two A alleles, and each Aa individual contributes one A allele, so 2×40+50=1302 \times 40 + 50 = 1302×40+50=130 A alleles.
-
Count the a alleles: each aa individual contributes two a alleles, and each Aa individual contributes one a allele, so 2×10+50=702 \times 10 + 50 = 702×10+50=70 a alleles.
-
Convert to frequencies: the frequency of A is 130÷200=0.65130 \div 200 = 0.65130÷200=0.65, and the frequency of a is 70÷200=0.3570 \div 200 = 0.3570÷200=0.35.
The Hardy-Weinberg principle
The Hardy-Weinberg principle is a mathematical model that predicts allele and genotype frequencies in a population that is not evolving.
Hardy-Weinberg equilibrium
A population is in Hardy-Weinberg equilibrium when allele frequencies and genotype frequencies stay constant from generation to generation, provided certain assumptions are met.
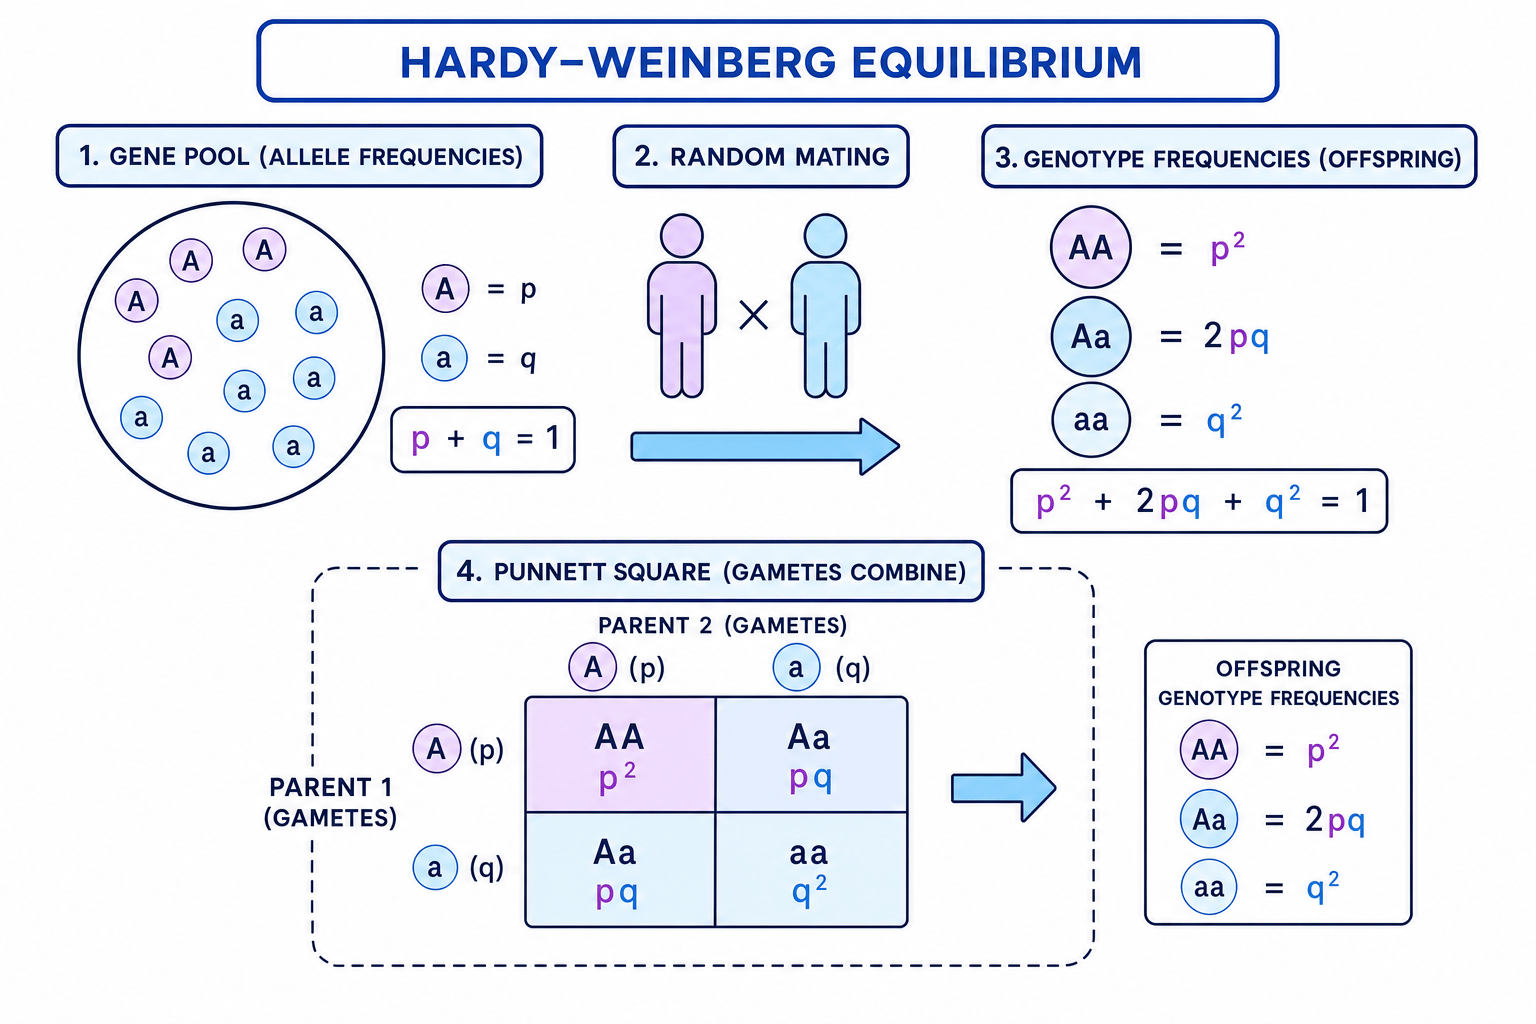
For a gene with two alleles, we use:
p+q=1p + q = 1p+q=1where ppp is the frequency of one allele, usually the dominant allele, and qqq is the frequency of the other allele, usually the recessive allele.
The genotype frequencies are:
p2+2pq+q2=1p^2 + 2pq + q^2 = 1p2+2pq+q2=1- p2p^2p2 = frequency of homozygous dominant genotype, AA
- 2pq2pq2pq = frequency of heterozygous genotype, Aa
- q2q^2q2 = frequency of homozygous recessive genotype, aa
The diagram below shows where the three genotype frequencies come from when gametes combine at random.
The big Hardy-Weinberg link
If mating is random and the assumptions are met, allele frequencies ppp and qqq predict genotype frequencies p2p^2p2, 2pq2pq2pq and q2q^2q2 in the next generation.
When Hardy-Weinberg applies
Hardy-Weinberg equilibrium is an ideal model. It assumes:
- a large population
- random mating
- no mutation
- no migration into or out of the population
- no natural selection
- no genetic drift affecting allele frequencies
Mutation is a change in the DNA base sequence, which can create new alleles. Migration can cause gene flow, meaning alleles move between populations when individuals enter or leave and reproduce. Natural selection is the process where individuals with advantageous alleles are more likely to survive and reproduce. Genetic drift is a random change in allele frequencies due to chance, especially in small populations.
Treating Hardy-Weinberg as reality
Hardy-Weinberg is not saying real populations never change. It is a null model: if observed data do not fit the prediction, that suggests factors such as selection, migration, mutation, non-random mating or drift may be acting.
Recognising a violated assumption
A population of insects is exposed to an insecticide. Insects with allele R survive better than insects without it.
-
Compare survival: individuals with allele R are more likely to survive and reproduce, so survival is not equal across genotypes.
-
Identify the assumption affected: this is natural selection, because one allele gives a reproductive advantage in that environment.
-
Predict the allele-frequency change: the frequency of allele R is likely to increase over generations, so the population is unlikely to remain in Hardy-Weinberg equilibrium.
Using Hardy-Weinberg in calculations
The most common exam calculation starts with a recessive phenotype. If the recessive condition is only shown by aa individuals, then:
q2=frequency of recessive phenotypeq^2 = \text{frequency of recessive phenotype}q2=frequency of recessive phenotypeThen you can find qqq by taking the square root, use p+q=1p + q = 1p+q=1 to find ppp, and calculate the carrier frequency using 2pq2pq2pq.
A carrier is a heterozygous individual who has one recessive allele but does not show the recessive phenotype.
Start with the recessive phenotype
If you are told the frequency of a recessive phenotype, set it equal to q2q^2q2, not qqq. The allele frequency qqq is found by taking the square root.
Estimating carrier frequency from a recessive condition
In a population of 10 000 people, 36 people have a recessive genetic condition caused by genotype aa. Estimate the number of carriers.
-
The affected individuals have genotype aa, so the recessive genotype frequency is q2=36÷10000=0.0036q^2 = 36 \div 10000 = 0.0036q2=36÷10000=0.0036.
-
Find the recessive allele frequency by taking the square root: q=0.0036=0.060q = \sqrt{0.0036} = 0.060q=0.0036=0.060.
-
Use p+q=1p + q = 1p+q=1 to find the dominant allele frequency: p=1−0.060=0.940p = 1 - 0.060 = 0.940p=1−0.060=0.940.
-
Calculate the carrier frequency: 2pq=2×0.940×0.060=0.11282pq = 2 \times 0.940 \times 0.060 = 0.11282pq=2×0.940×0.060=0.1128.
-
Convert the frequency to a number of people: 0.1128×10000=11280.1128 \times 10000 = 11280.1128×10000=1128 people, so about 1128 carriers are expected.
Using the dominant phenotype as p squared
If you are told the frequency of the dominant phenotype, you usually cannot set it equal to p2p^2p2, because the dominant phenotype includes both AA and Aa individuals.
Evolution as a change in allele frequency
In population genetics, evolution means a change in allele frequencies in a population over generations. This is why Hardy-Weinberg is useful: it gives you a prediction for “no evolution”, so changes from that prediction can point to evolutionary forces.
For example, if a new predator arrives and mainly catches pale individuals, alleles for darker colour may become more common. The population has evolved because the allele frequencies have changed.
Isolation and gene flow
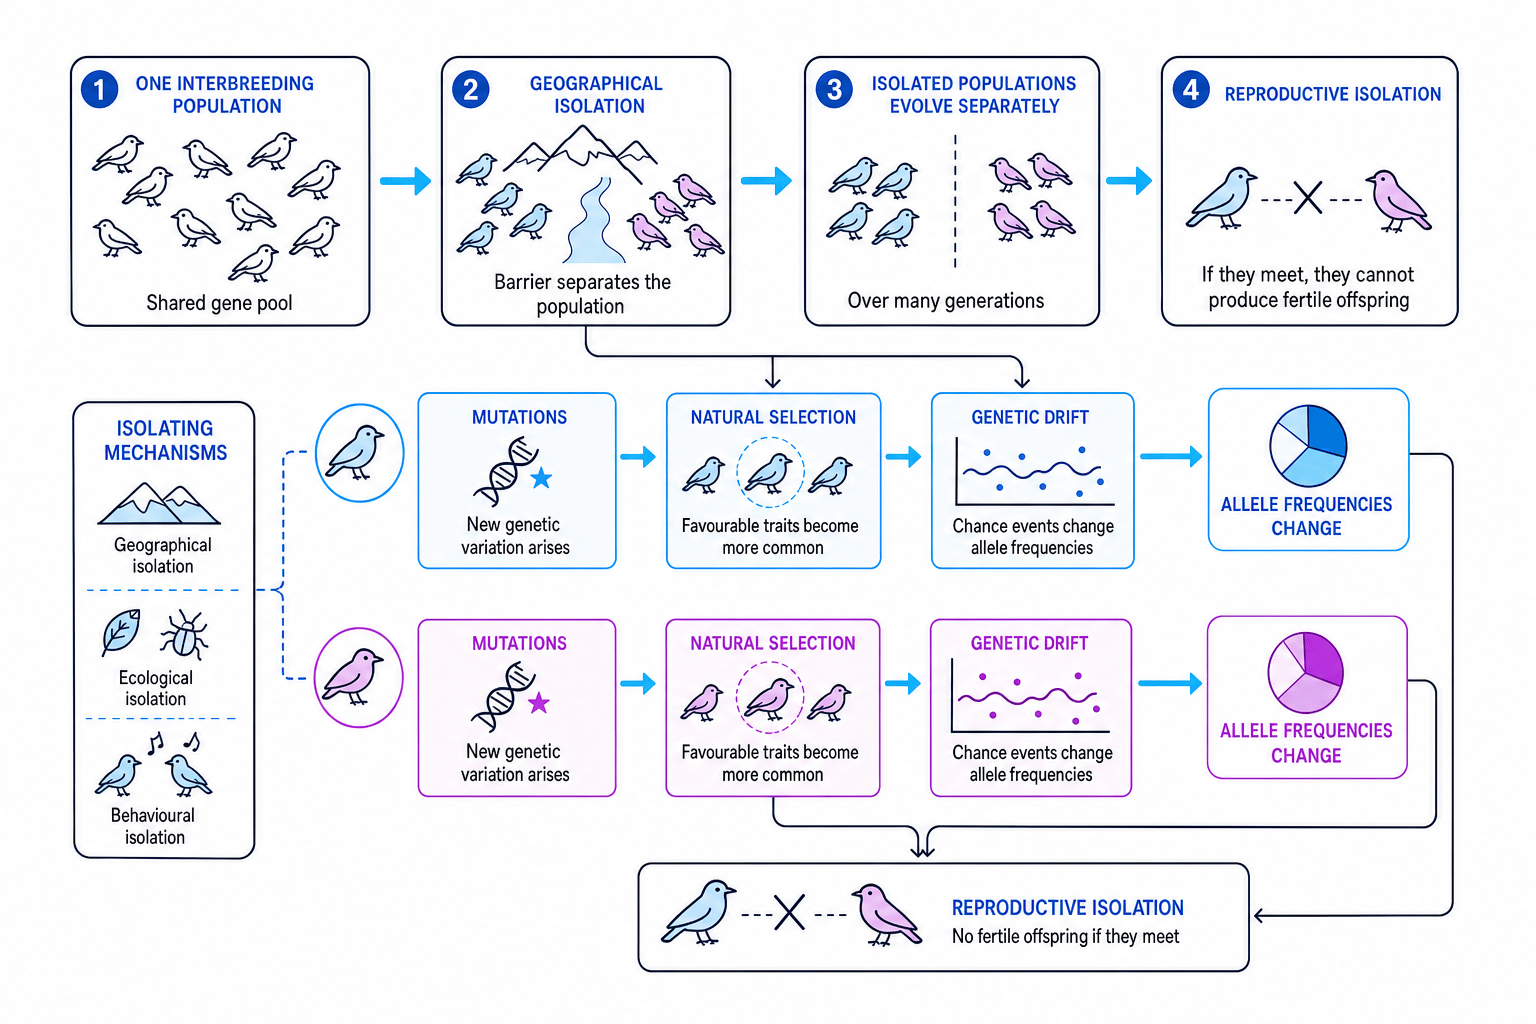
Isolation means separation between populations that reduces or stops interbreeding. If individuals from two populations cannot mate successfully, alleles cannot move freely between them. This reduces gene flow.
Important types of isolation include:
- Geographical isolation: a physical barrier separates populations, such as a mountain range, river or island separation.
- Ecological isolation: populations live in different habitats within the same area.
- Temporal isolation: populations reproduce at different times of day or year.
- Behavioural isolation: populations have different courtship behaviours or mating signals.
- Mechanical isolation: reproductive structures are incompatible.
- Gametic isolation: gametes cannot fuse successfully.
The diagram below shows how isolation can split one gene pool into two populations that evolve separately.
Speciation
Speciation is the formation of a new species. It happens when populations become so different that they can no longer interbreed to produce fertile offspring.
In allopatric speciation, populations are separated by a geographical barrier. In sympatric speciation, new species arise without a physical barrier, often because of ecological, behavioural or reproductive separation within the same area.
Speciation needs reproductive isolation
Different allele frequencies alone are not enough to define a new species. Speciation requires reproductive isolation: if the populations meet, they cannot produce fertile offspring.
The general sequence is:
- One population is split or becomes reproductively separated.
- Gene flow between the groups is reduced or stopped.
- Mutation introduces new variation in each group.
- Different selection pressures and genetic drift change allele frequencies.
- Over many generations, the populations become genetically and phenotypically different.
- Reproductive isolation evolves, so fertile offspring are no longer produced.
Explaining allopatric speciation
A bird population is split when sea level rises and forms two islands with different food sources.
-
The sea acts as a geographical barrier, so birds on the two islands no longer interbreed and gene flow is greatly reduced.
-
Different food sources create different selection pressures, so alleles that improve feeding success on each island are more likely to be passed on.
-
Mutations and genetic drift also change allele frequencies independently in the two smaller populations.
-
Over many generations, the populations diverge genetically and may develop different beak shapes, songs or mating behaviours.
-
If the birds later meet but cannot produce fertile offspring, reproductive isolation has occurred and they are now separate species.
Saying individuals evolve
Individuals do not evolve during their lifetime. Populations evolve because allele frequencies change across generations.
Using data carefully
In real studies, allele frequencies may be estimated from phenotype data, genotype data or DNA analysis. Phenotype data can be less reliable if the environment affects the characteristic or if dominant and heterozygous individuals look the same.
Good biological data should come from a large, representative sample. If a sample is too small, random variation can make allele frequencies look different from the true population values.
Small populations can drift quickly
Genetic drift is strongest in small populations. After a bottleneck or founder event, allele frequencies may change a lot by chance, even without natural selection.
In the exam
-
For Hardy-Weinberg calculations, write down p+q=1p + q = 1p+q=1 and p2+2pq+q2=1p^2 + 2pq + q^2 = 1p2+2pq+q2=1, then identify whether the question gives you q2q^2q2, qqq, or genotype counts.
-
If you are explaining speciation, use the chain: isolation stops gene flow, mutation and selection or drift change allele frequencies, populations diverge, reproductive isolation prevents fertile offspring.
-
Be precise with language: alleles become more common, populations evolve, and natural selection acts on phenotypes but changes allele frequencies.
Check yourself
- If 4% of a population shows a recessive phenotype, what value would you use for q2q^2q2?
- Why can geographical isolation lead to different allele frequencies in two populations?
- What is the difference between genetic drift and natural selection?