

What you'll learn
- How a species, population, gene pool and allele frequency are linked.
- Why populations are the unit where evolution is measured.
- How the Hardy–Weinberg principle predicts allele, genotype and phenotype frequencies.
- How to use p2+2pq+q2=1p^2 + 2pq + q^2 = 1p2+2pq+q2=1 in A-Level calculations.
Species and populations
A species can exist as one large population or as several separate populations in different places. For example, the same species of beetle might have one population in one woodland and another population in a different woodland.
Species and population
A species is a group of organisms that can reproduce with one another to produce fertile offspring. A population is a group of organisms of the same species occupying a particular space at a particular time that can potentially interbreed.
The phrase “particular space at a particular time” matters. Populations are not just defined by species; they are also defined by location and time. A population of limpets on one rocky shore in June is not automatically the same population as limpets on another shore in September.
Why populations matter
Evolution is usually described as a change in allele frequencies in a population over time. Individual organisms do not change their alleles during life, but the genetic make-up of the population can change between generations.
Deciding whether organisms are one population
A biologist studies rabbits in two fields separated by a busy road. The rabbits are the same species, but they rarely cross the road.
- Check the species: because the rabbits can potentially breed with each other and produce fertile offspring, they are members of the same species.
- Check the space and interbreeding: if the road prevents regular breeding between the two fields, the rabbits in each field may form separate populations.
- Make the conclusion: the species exists as at least two populations, each with its own local breeding group.
Gene pools and allele frequencies
An allele is a version of a gene. For example, a gene affecting flower colour might have one allele for purple flowers and one allele for white flowers.
Gene pool
The gene pool is the total collection of all the alleles of all the genes in a population at a particular time.
A population with lots of different alleles has a more varied gene pool. This genetic variation is important because natural selection can only act on variation that already exists, or on new variation produced by mutation.
Allele frequency
An allele frequency is the proportion of all copies of a gene in a population that are a particular allele.
For a diploid organism, each individual usually has two copies of each autosomal gene, one from each parent. So, if you are counting alleles for one gene, the total number of allele copies is usually twice the number of individuals.
allele frequency=number of copies of the alleletotal number of allele copies for that gene\text{allele frequency} = \frac{\text{number of copies of the allele}}{\text{total number of allele copies for that gene}}allele frequency=total number of allele copies for that genenumber of copies of the alleleAllele frequencies are proportions, so they have no units. They can be written as decimals, fractions or percentages, but decimals are usually easiest for Hardy–Weinberg calculations.
Calculating allele frequency from genotype counts
In a population of 100 diploid plants, 20 have genotype RR, 50 have genotype Rr and 30 have genotype rr. Calculate the frequencies of the R and r alleles.
- Count the total allele copies: 100 plants each have two copies of the gene, so there are 200 allele copies in total.
- Count R alleles: each RR plant contributes two R alleles and each Rr plant contributes one R allele, so 2×20+50=902 \times 20 + 50 = 902×20+50=90 R alleles.
- Calculate the R allele frequency: p=90200=0.45p = \frac{90}{200} = 0.45p=20090=0.45.
- Use the fact that the two allele frequencies must add to 1: q=1−0.45=0.55q = 1 - 0.45 = 0.55q=1−0.45=0.55. The r allele frequency is 0.55.
Genotypes, phenotypes and notation
A genotype is the combination of alleles an organism has for a gene, such as AA, Aa or aa. A phenotype is the observable characteristic, such as purple flowers or white flowers.
A homozygous genotype has two identical alleles, such as AA or aa. A heterozygous genotype has two different alleles, such as Aa.
For Hardy–Weinberg questions, the allele frequencies are usually labelled:
- ppp = frequency of one allele, usually the dominant allele
- qqq = frequency of the other allele, usually the recessive allele
Because there are only two alleles in the simple A-Level model:
p+q=1p + q = 1p+q=1Naming p and q
Always state what ppp and qqq represent in the question. The letters are just labels; the biology comes from linking them to the actual alleles.
The Hardy–Weinberg principle
The Hardy–Weinberg principle is a mathematical model. It predicts what happens to allele and genotype frequencies if nothing is causing them to change.
Hardy–Weinberg principle
The Hardy–Weinberg principle states that allele frequencies in a population will remain constant from generation to generation if certain conditions are met.
The model is useful because it gives a “no change” expectation. If real data do not match Hardy–Weinberg predictions, that suggests at least one assumption may not be true.
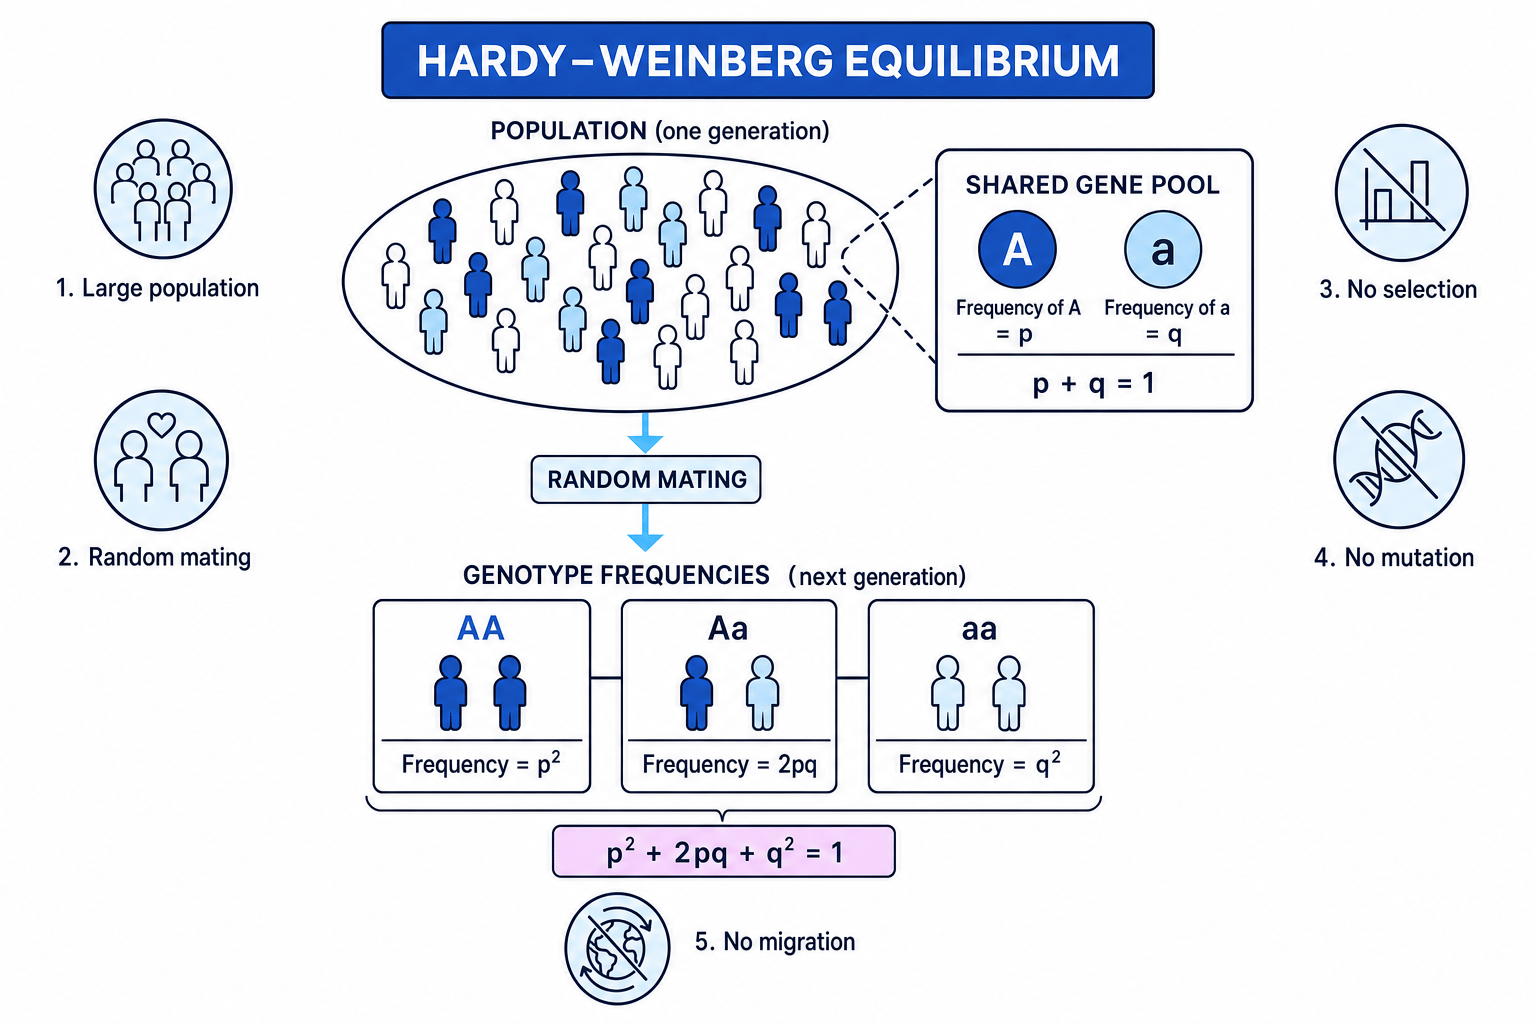
Conditions for Hardy–Weinberg equilibrium
For the principle to apply, the population should have:
- a large population size, so random chance has little effect
- random mating, so all genotypes have an equal chance of mating
- no natural selection, so no genotype has a survival or reproductive advantage
- no mutation, so new alleles are not being produced
- no migration, so alleles are not entering or leaving the population
Random changes in allele frequency due to chance are called genetic drift. Genetic drift has a stronger effect in small populations, which is why Hardy–Weinberg assumes a large population.
What equilibrium means
Hardy–Weinberg equilibrium means allele frequencies are not changing between generations. It does not mean every genotype is equally common.
The Hardy–Weinberg equation
If there are two alleles, A and a:
p+q=1p + q = 1p+q=1When gametes combine at random, genotype frequencies are predicted by:
p2+2pq+q2=1p^2 + 2pq + q^2 = 1p2+2pq+q2=1The three terms represent:
- p2p^2p2 = frequency of homozygous dominant genotype, AA
- 2pq2pq2pq = frequency of heterozygous genotype, Aa
- q2q^2q2 = frequency of homozygous recessive genotype, aa
The 2pq2pq2pq term appears because a heterozygote can be formed in two equivalent ways: A from one parent and a from the other, or a from one parent and A from the other.
Predicting genotype frequencies from allele frequencies
In a population, the frequency of allele A is 0.70 and the frequency of allele a is 0.30. Predict the genotype frequencies.
-
Assign the allele frequencies: p=0.70p = 0.70p=0.70 and q=0.30q = 0.30q=0.30.
-
Substitute into the Hardy–Weinberg terms:
p2=0.702=0.492pq=2×0.70×0.30=0.42q2=0.302=0.09\begin{aligned} p^2 &= 0.70^2 = 0.49 \\ 2pq &= 2 \times 0.70 \times 0.30 = 0.42 \\ q^2 &= 0.30^2 = 0.09 \end{aligned}p22pqq2=0.702=0.49=2×0.70×0.30=0.42=0.302=0.09 -
Interpret the results: 0.49 of the population is predicted to be AA, 0.42 is predicted to be Aa and 0.09 is predicted to be aa.
-
Check the frequencies add to 1: 0.49+0.42+0.09=1.000.49 + 0.42 + 0.09 = 1.000.49+0.42+0.09=1.00.
Using phenotype data
In many questions, you are not given genotype counts directly. Instead, you may be told the frequency of an observable phenotype.
This is especially useful for recessive phenotypes. If a recessive phenotype only appears in homozygous recessive individuals, then the frequency of that phenotype is q2q^2q2.
Start with the recessive phenotype
If the question gives the frequency of individuals showing a recessive characteristic, treat that frequency as q2q^2q2, then square root it to find qqq.
Calculating carrier frequency from a recessive phenotype
In a population of 10,000 newborns, 25 have a recessive disorder caused by genotype aa. Estimate the number of heterozygous carriers.
-
The affected newborns are aa, so their frequency is q2q^2q2:
q2=25 newborns10 000 newborns=0.0025q^2 = \frac{25\ \text{newborns}}{10\,000\ \text{newborns}} = 0.0025q2=10000 newborns25 newborns=0.0025The units cancel, so this is a dimensionless frequency.
-
Find qqq and then ppp:
q=0.0025=0.05p=1−0.05=0.95\begin{aligned} q &= \sqrt{0.0025} = 0.05 \\ p &= 1 - 0.05 = 0.95 \end{aligned}qp=0.0025=0.05=1−0.05=0.95 -
Carriers are heterozygous, so use 2pq2pq2pq:
2pq=2×0.95×0.05=0.0952pq = 2 \times 0.95 \times 0.05 = 0.0952pq=2×0.95×0.05=0.095 -
Convert the frequency into a number of newborns: 0.095×10 000=9500.095 \times 10\,000 = 9500.095×10000=950. The estimated number of carriers is 950 newborns.
Using the dominant phenotype incorrectly
The dominant phenotype is not just p2p^2p2. It includes both AA and Aa individuals, so its frequency is p2+2pqp^2 + 2pqp2+2pq.
Collecting data from a population
You may be asked how phenotype frequencies could be collected from a single population. The key is to sample fairly from a defined population.
For example, if you were recording flower colour in a plant population, you should define the area, sample at the same time, choose individuals randomly where possible, and record a large enough sample to reduce the effect of chance.
When the simple equation is not enough
The A-Level Hardy–Weinberg equation assumes one gene with two alleles. If there are more than two alleles, sex-linked inheritance, non-random mating or strong selection, the simple form may not apply reliably.
In the exam
- Define ppp and qqq before calculating, then use p+q=1p + q = 1p+q=1 to find the missing allele frequency.
- If you are given a recessive phenotype frequency, start with q2q^2q2, not qqq.
- When interpreting real populations, mention the assumptions: large population, random mating, no selection, no mutation and no migration.
Check yourself
- What is the difference between a species, a population and a gene pool?
- If 9% of a population shows a recessive phenotype, what are qqq, ppp and 2pq2pq2pq?
- Name two conditions needed for Hardy–Weinberg equilibrium and explain why each matters.
