All cells arise from other cells

EasyMedium
1234567891011
Question 10
Medium

Figure 1 shows the mean distance between chromatids and the poles (ends) of the spindle during mitosis in a eukaryotic cell.
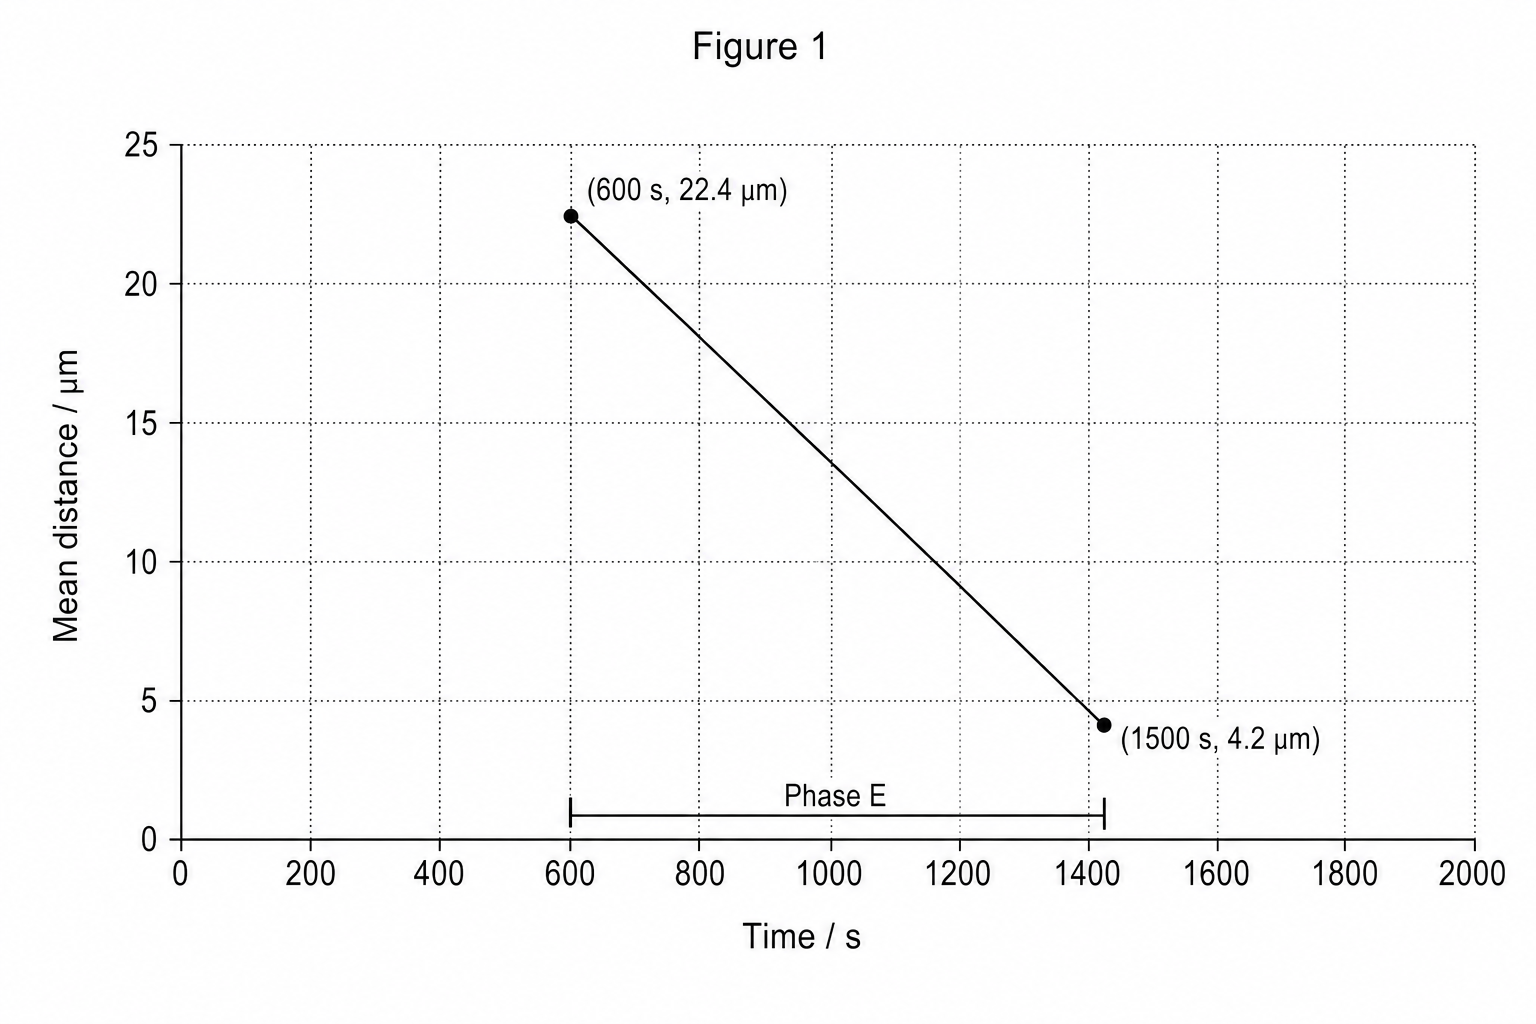
A line graph titled 'Figure 1' showing how the mean distance between chromatids and spindle poles changes over time during mitosis. The y-axis is labeled 'Mean distance / \mu m' and has a scale from 0 to 25 with gridlines. The x-axis is labeled 'Time / s' and has a scale from 0 to 2000, with gridlines every 100 seconds. The graph is divided into regions including Phase E, which starts at 600 s and ends at 1500 s. In Phase E, the curve begins exactly at 600 s with a mean distance of 22.4 \mu m and decreases steadily to end exactly at 1500 s with a mean distance of 4.2 \mu m.

Calculate the rate of movement of the chromatids during phase E.

Give your answer in μm⋅minute−1\mu\text{m}\cdot\text{minute}^{-1}μm⋅minute−1 and to 3 decimal places.

[4]

All cells arise from other cells Questions

  1. A Level
  2. /Biology
  3. /All cells arise from other cells