Definition
Output gap: the difference between actual output and potential (trend) output.
Positive output gap: when actual output is above the trend level.
Negative output gap: when actual output is below the trend level.
Showing gaps on a diagram
- On a trend-output chart, the gap is the vertical distance of actual output from the long-run trend.
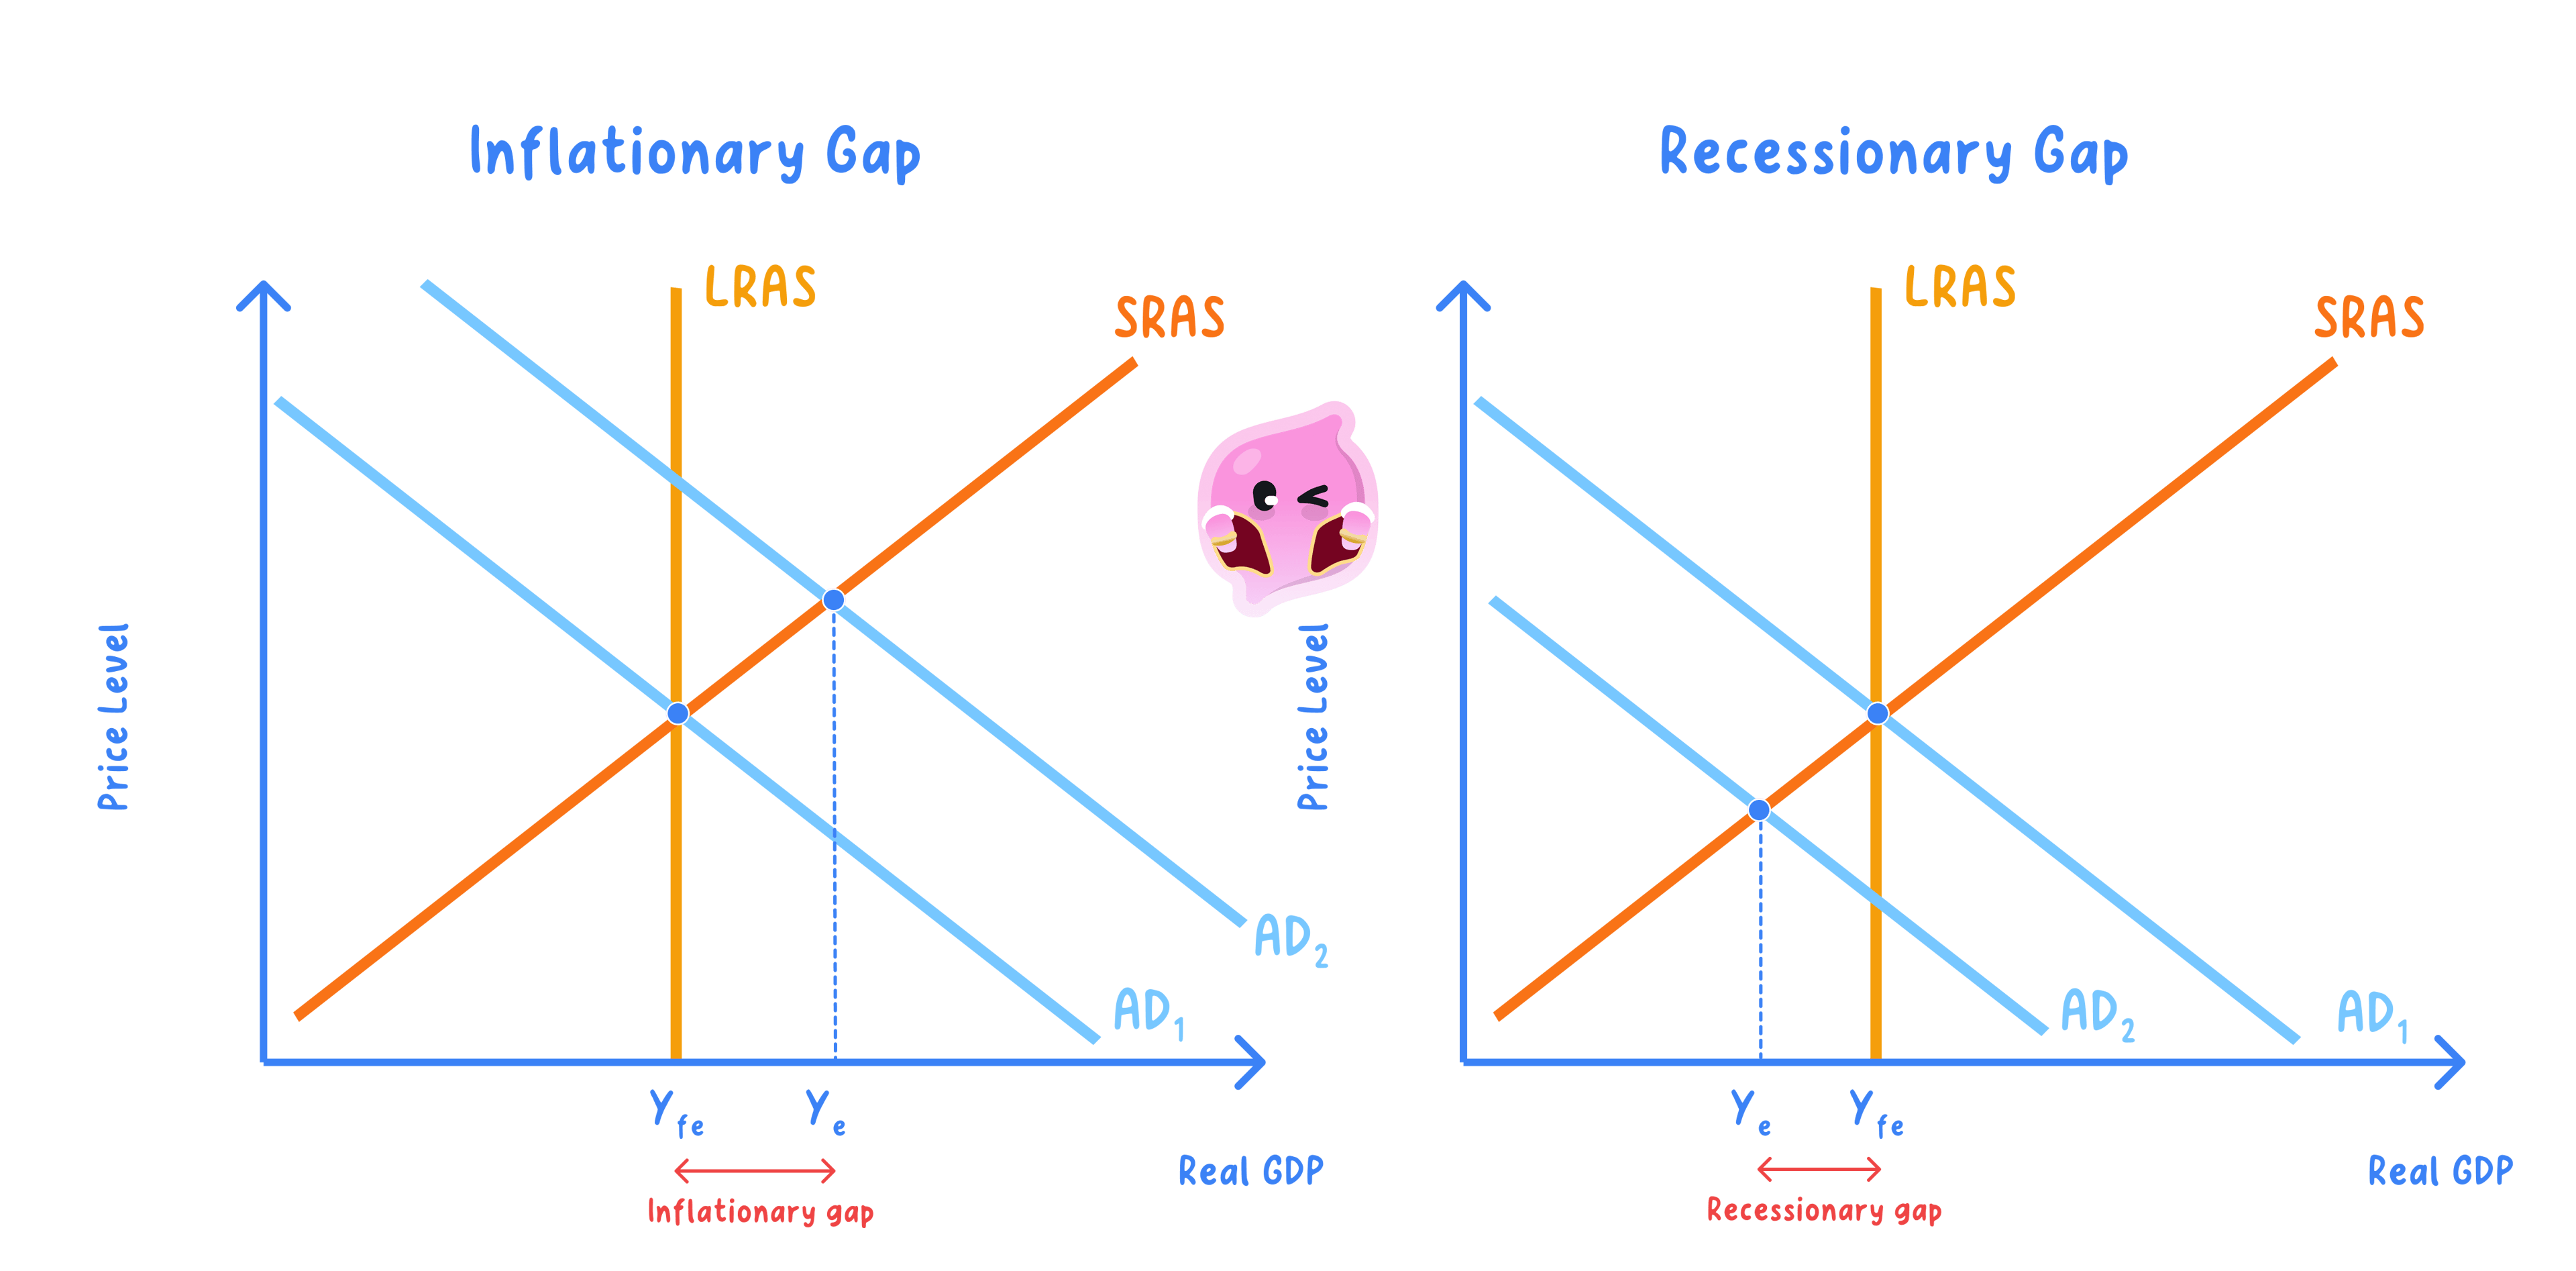
- On an AD/AS diagram, a positive gap shows output beyond the full-capacity level and a negative gap shows output below it, with axes average price level and real output.
- A negative gap can also be shown as a point inside the production possibility curve.
Example
- Actual output is £520bn while potential is £500bn, so output is 4% above trend.
- A positive gap of 4% signals an overheating economy, as during China's boom in the mid-2000s, with building inflationary pressure.
What each gap implies
- A positive gap means demand is running ahead of capacity, so scarce resources bid up wages and prices, generating demand-pull inflation.
- A negative gap means spare capacity, so unemployment is higher and price pressure is weak.
- Output gaps therefore link directly to the twin problems of inflation and unemployment.
Example
- In a recession actual output falls to £475bn against potential of £500bn, 5% below trend.
- A negative gap of 5% means idle resources and rising unemployment, as in the United States during the 2009 recession.
Why gaps guide policy
- A positive gap can prompt tighter policy, such as higher interest rates, to curb inflation.
- A negative gap can prompt looser policy to support demand and reabsorb idle resources.
- A large negative gap suggests room to raise demand without much inflation, whereas a positive gap warns that extra demand may just raise prices.
Note
- Output gaps help judge which stage of the business cycle the economy is in.
- The right response depends on the size of the gap and on how reliable the estimate is.
Why gaps are hard to measure
- Potential output cannot be observed directly, only estimated.
- So estimates of the gap are uncertain and are revised as more data arrive.
- On balance, output gaps are a useful guide to the cycle, but the measurement difficulty means they should inform, not dictate, policy.
Exam technique
- Define the gap as actual output − potential output.
- Link a positive gap to inflation and a negative gap to unemployment, and show it on an AD/AS diagram.
Common Mistake
- Do not confuse a negative output gap with negative economic growth; a negative gap is a level below potential, not a fall in output.
- Do not treat a measured output gap as precise.
Self review
- Define an output gap.
- What is a positive output gap and what does it imply for inflation?
- Calculate the gap when actual output is £520bn and potential is £500bn.
- Why are output gaps hard to measure?
- How does a negative output gap differ from negative growth?
