Actual and potential growth
Definition
Actual growth: the rate of change of real output (real GDP) in the short run, using up spare capacity.
Potential growth: an increase in the productive capacity of the economy, raising the maximum output it can produce.
Showing the two on diagrams
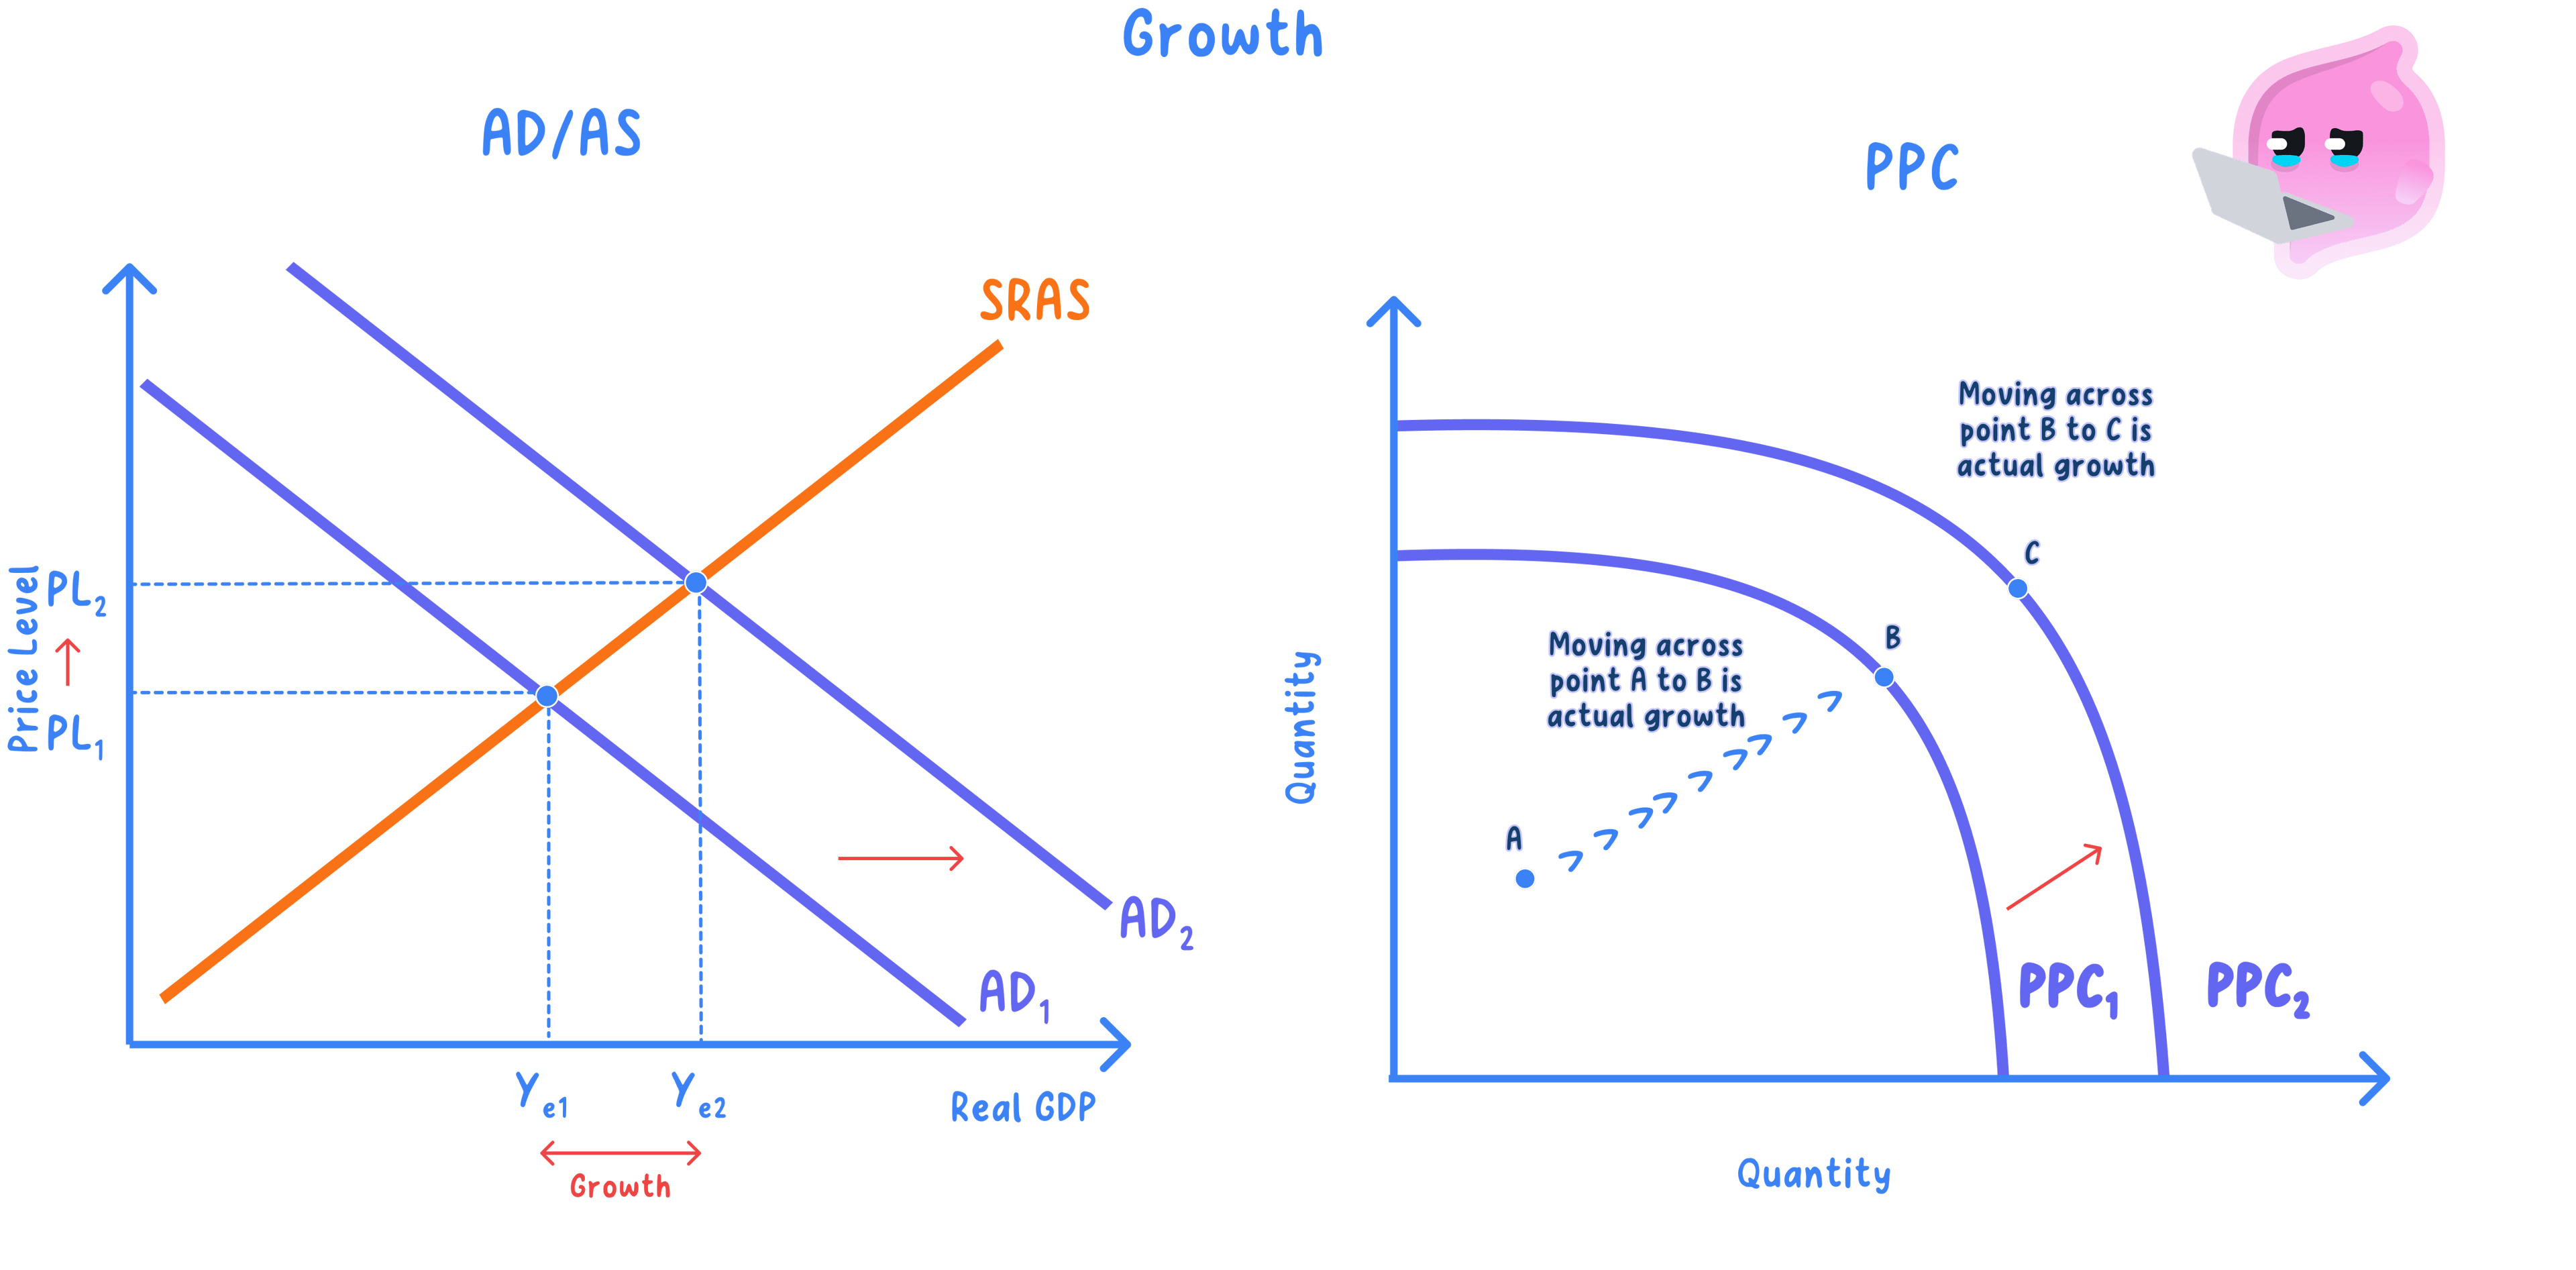
- On a production possibility curve, actual growth is a movement from a point inside the curve towards the frontier.
- Potential growth is an outward shift of the whole curve, because the frontier itself moves.
- On an AD/AS diagram, actual growth is a rise in real output as AD rises and spare capacity is used.
- Potential growth is a rightward shift of long-run aggregate supply, with the axes being the average price level and real output.
Example
- Reopening a mothballed steel plant adds output from existing resources, so it is actual growth.
- China's decades of large-scale investment in new factories, roads and skills expanded capacity, so it is potential growth.
Measuring actual growth
- Actual growth is measured as the % change in real GDP from one year to the next.
- Real, not nominal, GDP is used so that inflation is stripped out and only volume changes count.
Example
- Real GDP rises from £480bn to £504bn over a year, an increase of £24bn.
- Actual growth is 5%, but this figure alone does not reveal whether capacity also expanded.
Causes of potential growth
- A greater quantity of factors, such as a larger labour force or more capital, raises capacity.
- Higher-quality factors, such as a more skilled workforce, raise productivity per unit of input.
- Investment in new capital and infrastructure expands capacity over time.
- Technological progress lets the same resources produce more, shifting LRAS right.
Note
- Actual and potential growth usually move together over the long run.
- Sustained rises in living standards depend on potential growth, not just fuller use of capacity.
Why the distinction matters
- Using spare capacity can raise output quickly, as India did rebounding from the 2020 downturn, but only up to the capacity ceiling.
- Once the frontier is reached, only more capacity allows further sustained long-run growth.
- So the two describe different sources of higher output, and whether growth lasts depends on which is at work.
Exam technique
- Use a movement towards the PPC for actual growth and an outward shift for potential growth.
- Show potential growth as a rightward LRAS shift, with axes average price level and real output.
Common Mistake
- Do not treat every rise in measured GDP as a rise in capacity.
- It may be spare capacity being used more fully, not more capacity being created.
Self review
- Define actual growth.
- Define potential growth.
- How is potential growth shown on a PPC and on an AD/AS diagram?
- Calculate actual growth if real GDP rises from £480bn to £504bn.
- Name two causes of potential growth.
