Producer surplus
Definition
Producer surplus: the gap between the price a producer actually receives and the lower minimum price the producer would have accepted.
Marginal cost: the cost of producing one more unit, which sets the minimum price a firm will accept for that unit.
PS=12×base×height \text{PS} = \tfrac{1}{2} \times \text{base} \times \text{height} PS=21×base×height- The supply curve traces the minimum acceptable price for each unit, which reflects that unit's marginal cost.
- Picture a farmer who would sell a crate of apples for as little as £3, yet the market price is £5; the £5 − £3 = £2 kept on that crate is producer surplus.
- Because every seller receives the single market price, any unit whose marginal cost is below that price earns the difference, so a higher price feeds through into a larger gain.
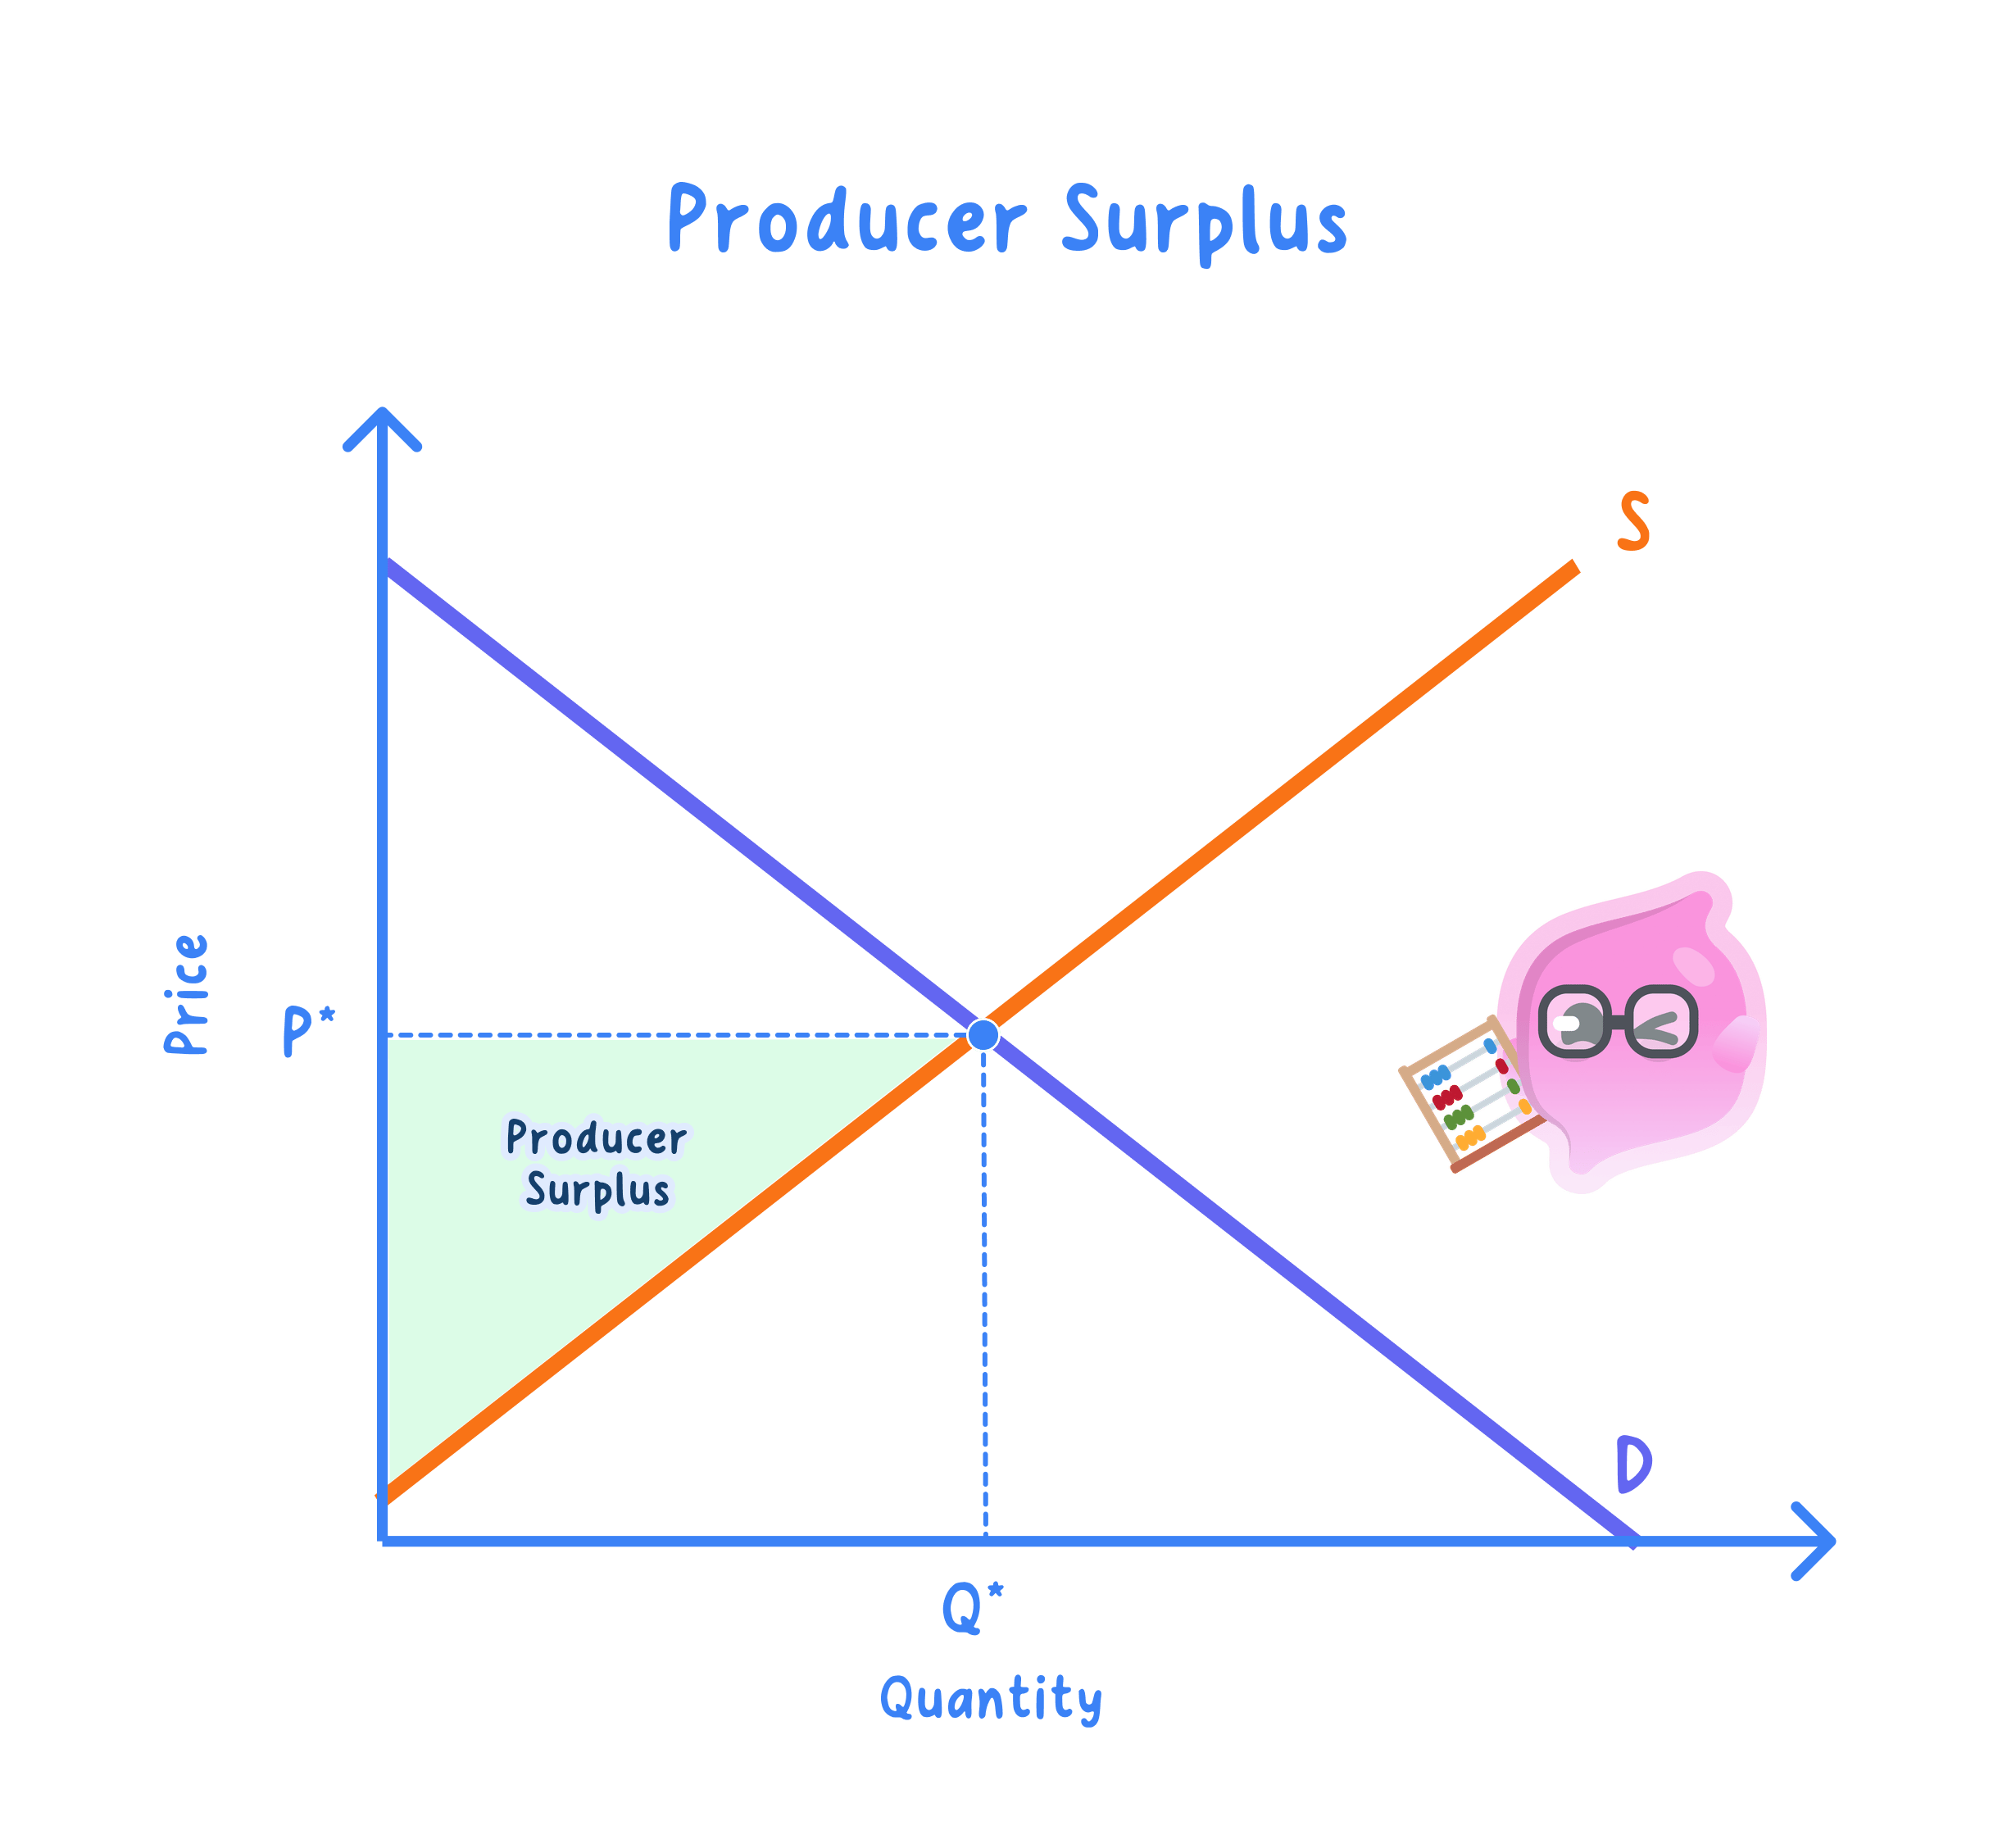
- On a diagram this gain is the area above the supply curve and below the market price, so it can be measured in £ directly.
- Summed across all sellers, it measures the net benefit, or welfare, that producers draw from taking part in the market.
Key Idea
- Producer surplus is the extra revenue firms receive above their minimum acceptable price.
- It is shown as the area above the supply curve and below the price.
- A higher price makes this area larger, so dearer goods raise seller welfare.
Reading the diagram
- Price sits on the vertical axis and quantity on the horizontal axis, so vertical distances represent money values.
- The height of the supply curve at each unit shows the least a producer would accept for that unit.
- The gap between the market price and that height is the surplus earned on that unit.
- Adding this gap across every unit sold gives total producer surplus.
Measuring the area
- With a straight-line supply curve the surplus is a triangle, so simple geometry gives its size.
- The bottom of the supply curve shows the lowest price at which any unit is offered.
- The height of the triangle is the market price − that lowest offer price.
- The base of the triangle is the quantity actually sold.
Producer surplus (linear supply):
PS=12×b×h PS = \tfrac{1}{2} \times b \times h PS=21×b×h h=P−Pminb=Q h = P - P_{\text{min}} \qquad b = Q h=P−Pminb=QExample
- Coffee prices rise 60% so the market price reaches £8, the lowest bean growers will accept is £2, and 12,000 sacks sell.
- The £36,000 triangle is the welfare growers gain above their costs, which is why higher prices please suppliers even before profit is worked out.
What changes it
- A rise in price raises producer surplus, because firms earn more above their minimum on each unit and are drawn to supply more units.
- A fall in price lowers it, as the top slice of the triangle is lost and higher-cost units stop being supplied.
- A fall in costs, say cheaper fuel, shifts supply right and lowers the minimum acceptable price; surplus per unit widens even if price later drifts down, so the net effect depends on how far price falls.
Why it matters
Definition
Community surplus: consumer surplus + producer surplus, the standard measure of the total welfare a market generates.
- It gives economists a £ measure of producer welfare, so the gain or loss from a price change, a tax or a subsidy can be compared directly.
- Set against consumer surplus, it becomes the yardstick for judging whether a market or policy raises total welfare or destroys it.
Evaluation
- It gives a clear, visual £ measure of the benefit producers draw from a market.
- But it is related to profit rather than identical to it, because it does not net off fixed costs such as rent or machinery.
- So it depends on the cost structure: with heavy fixed costs a large surplus can still mask a loss, so read it as welfare, not as a precise profit figure.
Exam technique
- Identify producer surplus as the area above supply and below price.
- For a linear supply curve, calculate it as ½ × base × height.
- Always tie the number back to the welfare gained by producers.
Common Mistake
- Do not confuse producer surplus with profit.
- Producer surplus does not deduct fixed costs, so it usually exceeds profit.
- Never shade the area above the price line.
Self review
- Define producer surplus.
- Where is producer surplus shown on a demand and supply diagram?
- With a lowest offer price of £4, a market price of £10 and quantity 20, what is producer surplus?
- How does a rise in price change producer surplus, and why?
- Why is producer surplus not the same as profit?
