Changes in surplus
Definition
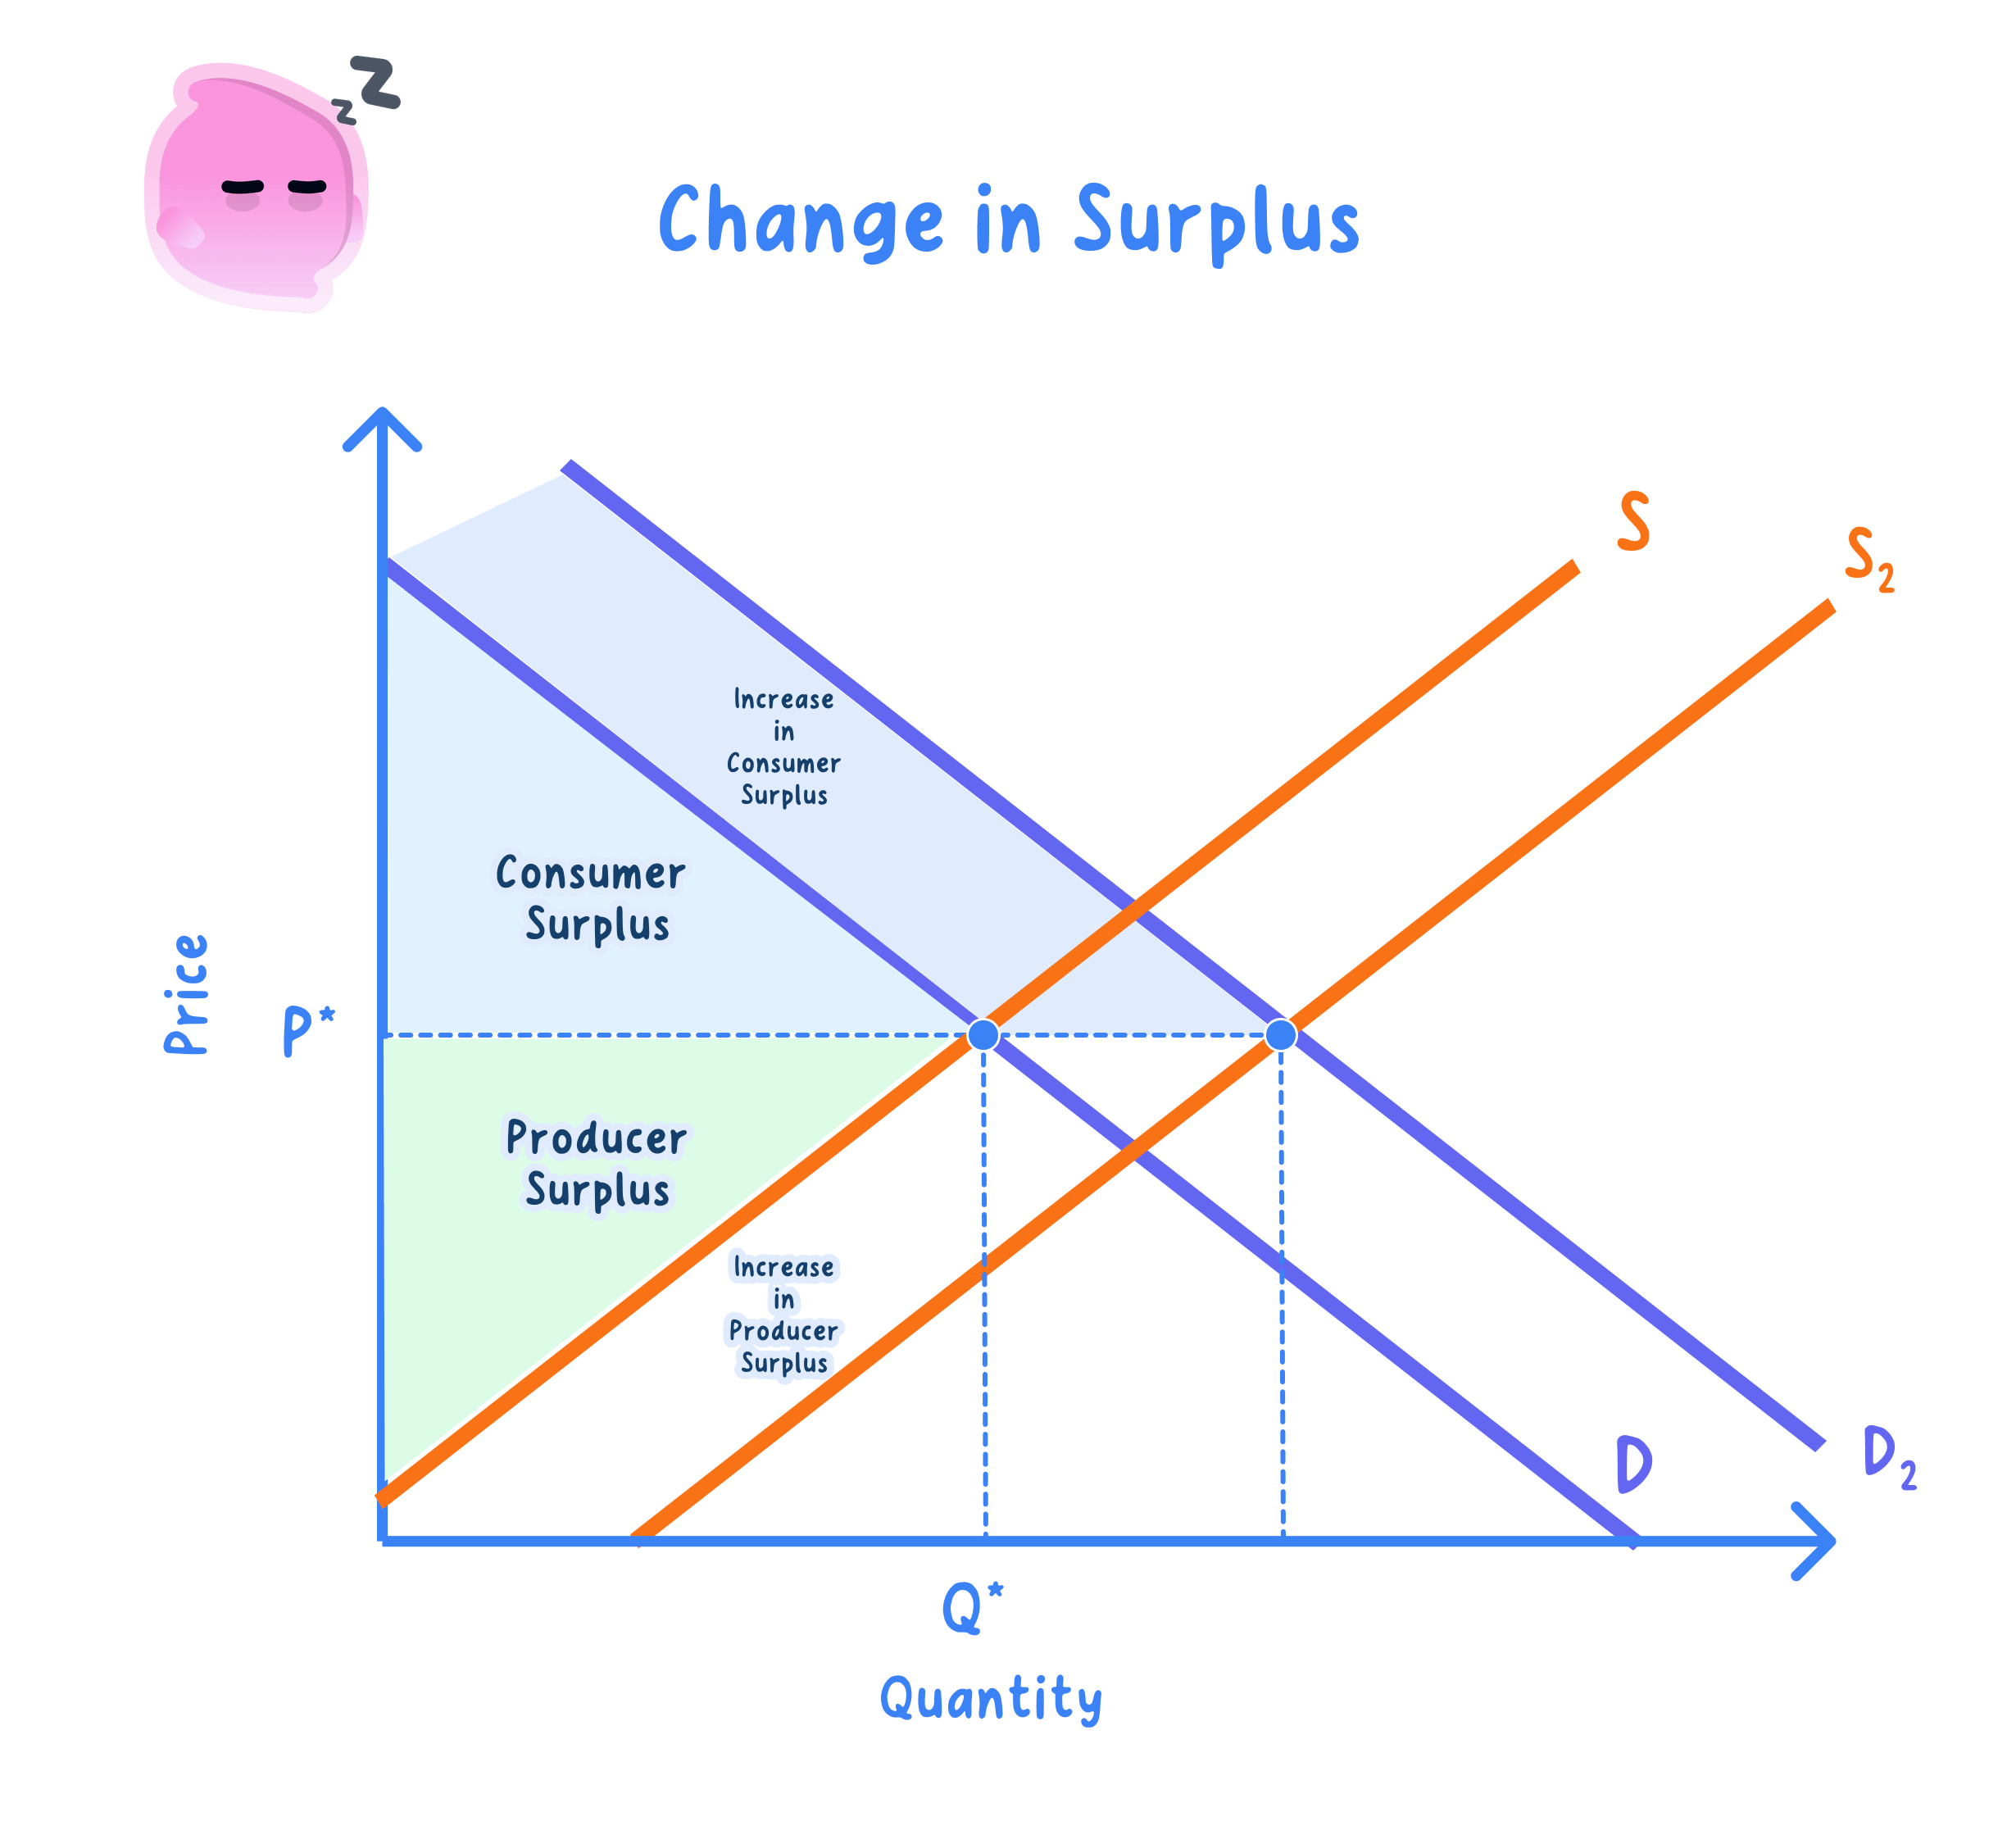
Consumer surplus: the area below the demand curve and above the price, the net gain to buyers.
Producer surplus: the area above the supply curve and below the price, the net gain to sellers.
Community surplus: consumer surplus + producer surplus, the standard measure of total welfare in a market.
Community surplus=CS+PS \text{Community surplus} = \text{CS} + \text{PS} Community surplus=CS+PS- The two surpluses stack around the market price: buyers keep the wedge above it, sellers keep the wedge below it.
- Their sum is largest at the free-market equilibrium, because every unit whose value to buyers exceeds its cost to sellers is traded and none that fails this test is.
- Anything that shifts a curve or forces the price away from equilibrium therefore resizes and redistributes these two surpluses.
Key Idea
- Consumer surplus + producer surplus = community surplus.
- Shifts in demand or supply, and changes in price, resize and redistribute these surpluses.
- Community surplus is at its maximum at the free-market equilibrium.
Reading the surpluses
- Shade the triangle below demand and above price to show what buyers gain.
- Shade the triangle above supply and below price to show what sellers gain.
- Together they fill the whole wedge between the curves up to the equilibrium quantity, and that wedge is community surplus.
Demand shifts
- A rightward shift in demand, say a viral trend for a trainer brand, raises both equilibrium price and quantity because buyers now value each pair more.
- Producer surplus rises, since firms sell more units and at a higher price on every unit.
- Consumer surplus usually rises too, as extra buyers trade, though the higher price claws back part of the gain, so the net effect depends on how far price climbs.
- A leftward shift in demand does the reverse, lowering price, quantity and producer surplus.
Supply shifts
- A rightward shift in supply, say cheaper solar panels, lowers the equilibrium price and raises quantity because unit costs have fallen.
- Consumer surplus rises, since buyers pay less and buy more.
- Producer surplus may rise or fall: it depends on whether the extra quantity sold outweighs the lower price earned on each unit.
Example
- Better technology raises supply, cutting price 25% from £8 to £6 and lifting quantity from 12 to 16 units, with a choke price of £20.
- Consumer surplus rises by £112 − £72 = £40, because buyers enjoy both a lower price and extra units.
Price changes and intervention
Definition
Deadweight loss: the community surplus lost when output moves away from equilibrium, reaching neither buyers, sellers nor the government.
- Holding the curves fixed, a fall in price raises consumer surplus and lowers producer surplus, transferring welfare from sellers to buyers.
- A rise in price does the reverse, transferring welfare from buyers to sellers.
- A tax, subsidy or price control forces the market off equilibrium, so the quantity traded shrinks and community surplus falls by the deadweight loss.
Note
- A £2 tax per unit raises the price to buyers and lowers the net price to sellers, shrinking both surpluses.
- Part of the lost surplus becomes government revenue, but the rest is deadweight loss reaching neither side.
Evaluation
- The direction of each surplus change is usually clear from the diagram.
- But the size of the change depends on the price elasticities of demand and supply.
- With inelastic demand buyers keep bearing the price change, so consumer surplus swings most; with inelastic supply producers bear more, so producer surplus swings most.
Exam technique
- Draw the diagram and shade consumer and producer surplus separately.
- Show the new areas after a shift or price change and compare them with the old.
- Link the size of the change to the elasticities of demand and supply.
Common Mistake
- Do not assume both surpluses always move in the same direction.
- A price change with fixed curves usually raises one surplus while lowering the other.
- Do not forget that community surplus is largest at the free-market equilibrium.
Self review
- What is community surplus?
- Where is total welfare maximised in a free market?
- How does a rightward shift in supply change consumer surplus, and why?
- With curves fixed, how does a fall in price change each surplus?
- Why does a tax reduce community surplus?
