Macroeconomic Equilibrium
Definition
Macroeconomic equilibrium: the point where aggregate demand equals aggregate supply, fixing the economy's real output, average price level and employment.
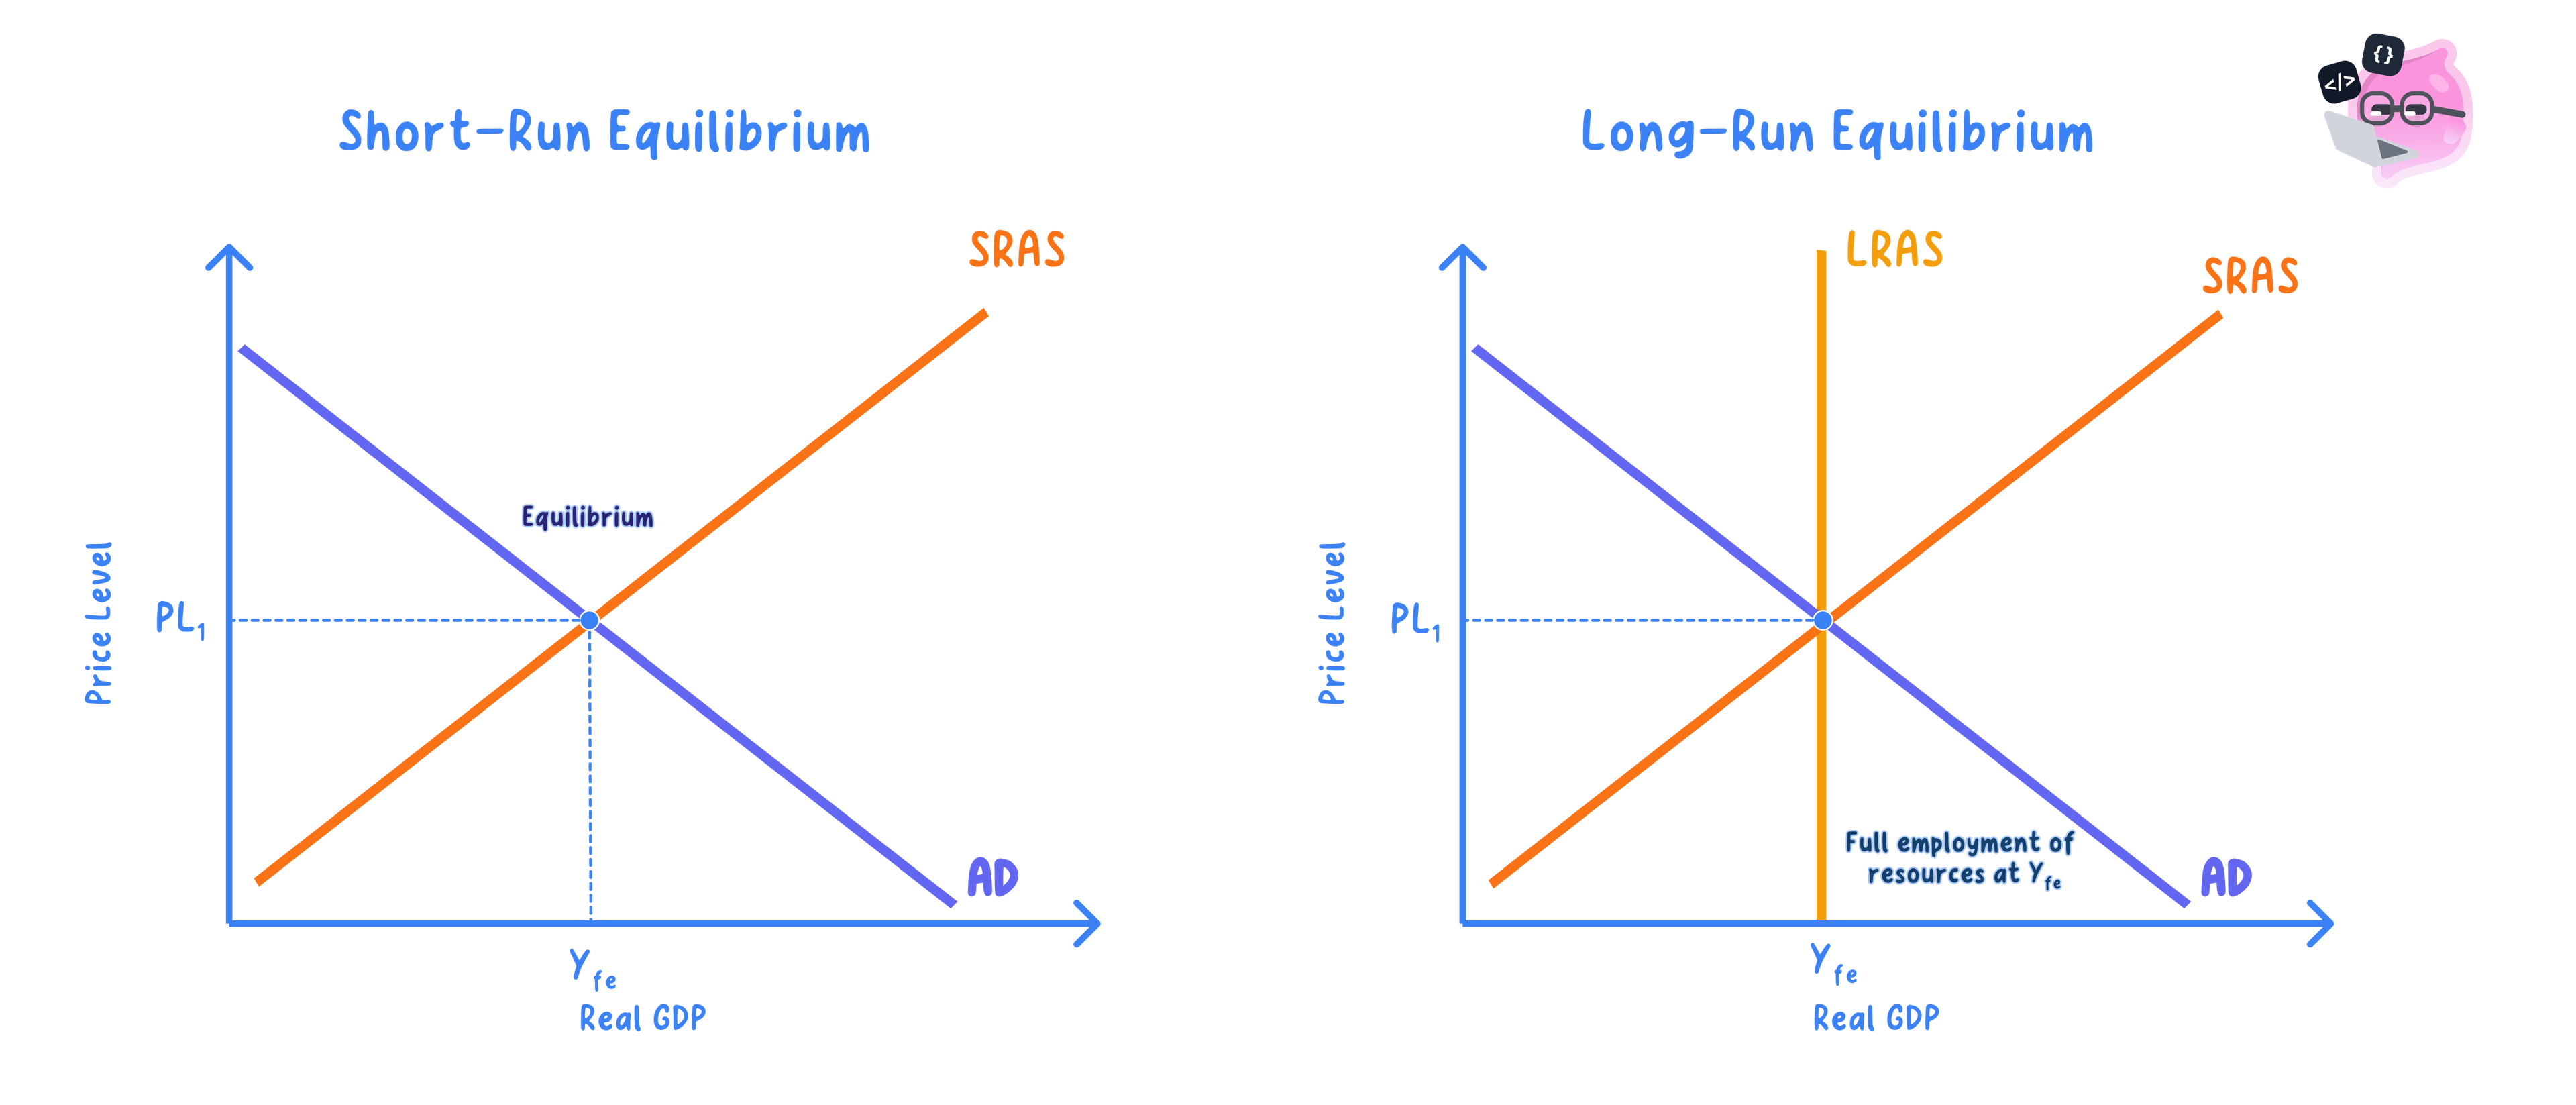
Full-employment output: the real output the economy produces when all who want work at going wages have it, shown where LRAS is vertical.
- The intersection sets the equilibrium level of real output and the average price level together.
- That output level in turn determines employment, because producing more output needs more labour.
Key Idea
- Equilibrium is the single point where AD and AS intersect.
- It fixes real output, the price level and, through output, employment.
Reading the Diagram
- The axes are the average price level (vertical) and real output (horizontal).
- Equilibrium is where the AD curve intersects the AS curve, because only there do planned demand and planned supply match.
- The price level is read off the vertical axis and output off the horizontal axis.
Example
- Suppose equilibrium sits at a price index of 100 and real GDP of £2,000bn.
- If the price level is 110, above equilibrium, firms supply £2,100bn but buyers demand only £1,900bn.
- A glut of £200bn of unsold output builds up, so firms cut prices to clear stock.
- The price level falls back toward 100, so the economy moves along the curves until AD = AS at £2,000bn.
- A price level below 100 works in reverse: excess demand runs down stocks and pulls the price level up.
Output, Prices and Employment
- Equilibrium real output is the total quantity of goods and services the economy produces.
- The equilibrium price level is the average of prices across the economy, read as a price index.
- Labour is a derived demand, so higher equilibrium output raises employment while lower output leaves workers idle.
Note
- Employment is derived from output, because producing more usually needs more workers.
- If equilibrium output is below full capacity, some labour is left unemployed.
How Equilibrium Can Change
- A shift in AD or AS moves the equilibrium to a new intersection point.
- This changes real output, the price level and employment together, though by how much depends on the slope of AS.
- A movement along the curves alone does not change the equilibrium position.
Does the model reliably predict where the economy settles?
- The intersection gives a clear, testable prediction of real output, the price level and employment, and the adjustment story, where gluts cut prices and shortages raise them, matches the way markets are seen to clear, so the model is a strong organising framework.
- But the smooth clearing it assumes is disputed: in the Keynesian view wages are sticky downward, so equilibrium can settle below full employment for years, meaning the resting point need not be the full-capacity level the classical model predicts.
- A single diagram is also a snapshot that assumes ceteris paribus, yet expectations, policy responses and fresh shocks keep moving the curves, so the predicted equilibrium may never be reached before it changes.
- On balance the model reliably predicts the direction in which output and prices settle, but how accurately it pins down the actual level of output and employment depends on how flexible wages and prices are and on the time horizon, so it is most trustworthy for the long-run classical case and least so for a short-run economy stuck below capacity.
Exam technique
- Mark equilibrium clearly where AD crosses AS.
- Read the price level and output off the two axes.
- Link the output level to the level of employment.
Common Mistake
- Do not assume equilibrium output is always the full-employment level.
- In the Keynesian view the economy can settle below full capacity.
Self review
- Where is macroeconomic equilibrium?
- What three things does equilibrium determine?
- How does the economy adjust if the price level is above equilibrium?
- How is employment linked to equilibrium output?
- What can move the equilibrium?
