Effects of AD and AS Shifts
Definition
Effect of a curve shift: the move of equilibrium to a new intersection that changes real output, the average price level and employment, with the direction set by which curve moves and which way.
- A shift in AD or AS moves the equilibrium to a new intersection point.
- This changes real output, the price level and employment together.
- The direction and size of the effect depend on which curve shifts and where the economy starts.
Key Idea
- A rightward shift in AD or AS tends to raise real output and employment.
- A rightward AD shift raises the price level, while a rightward AS shift tends to lower it.
Effects of an AD Shift
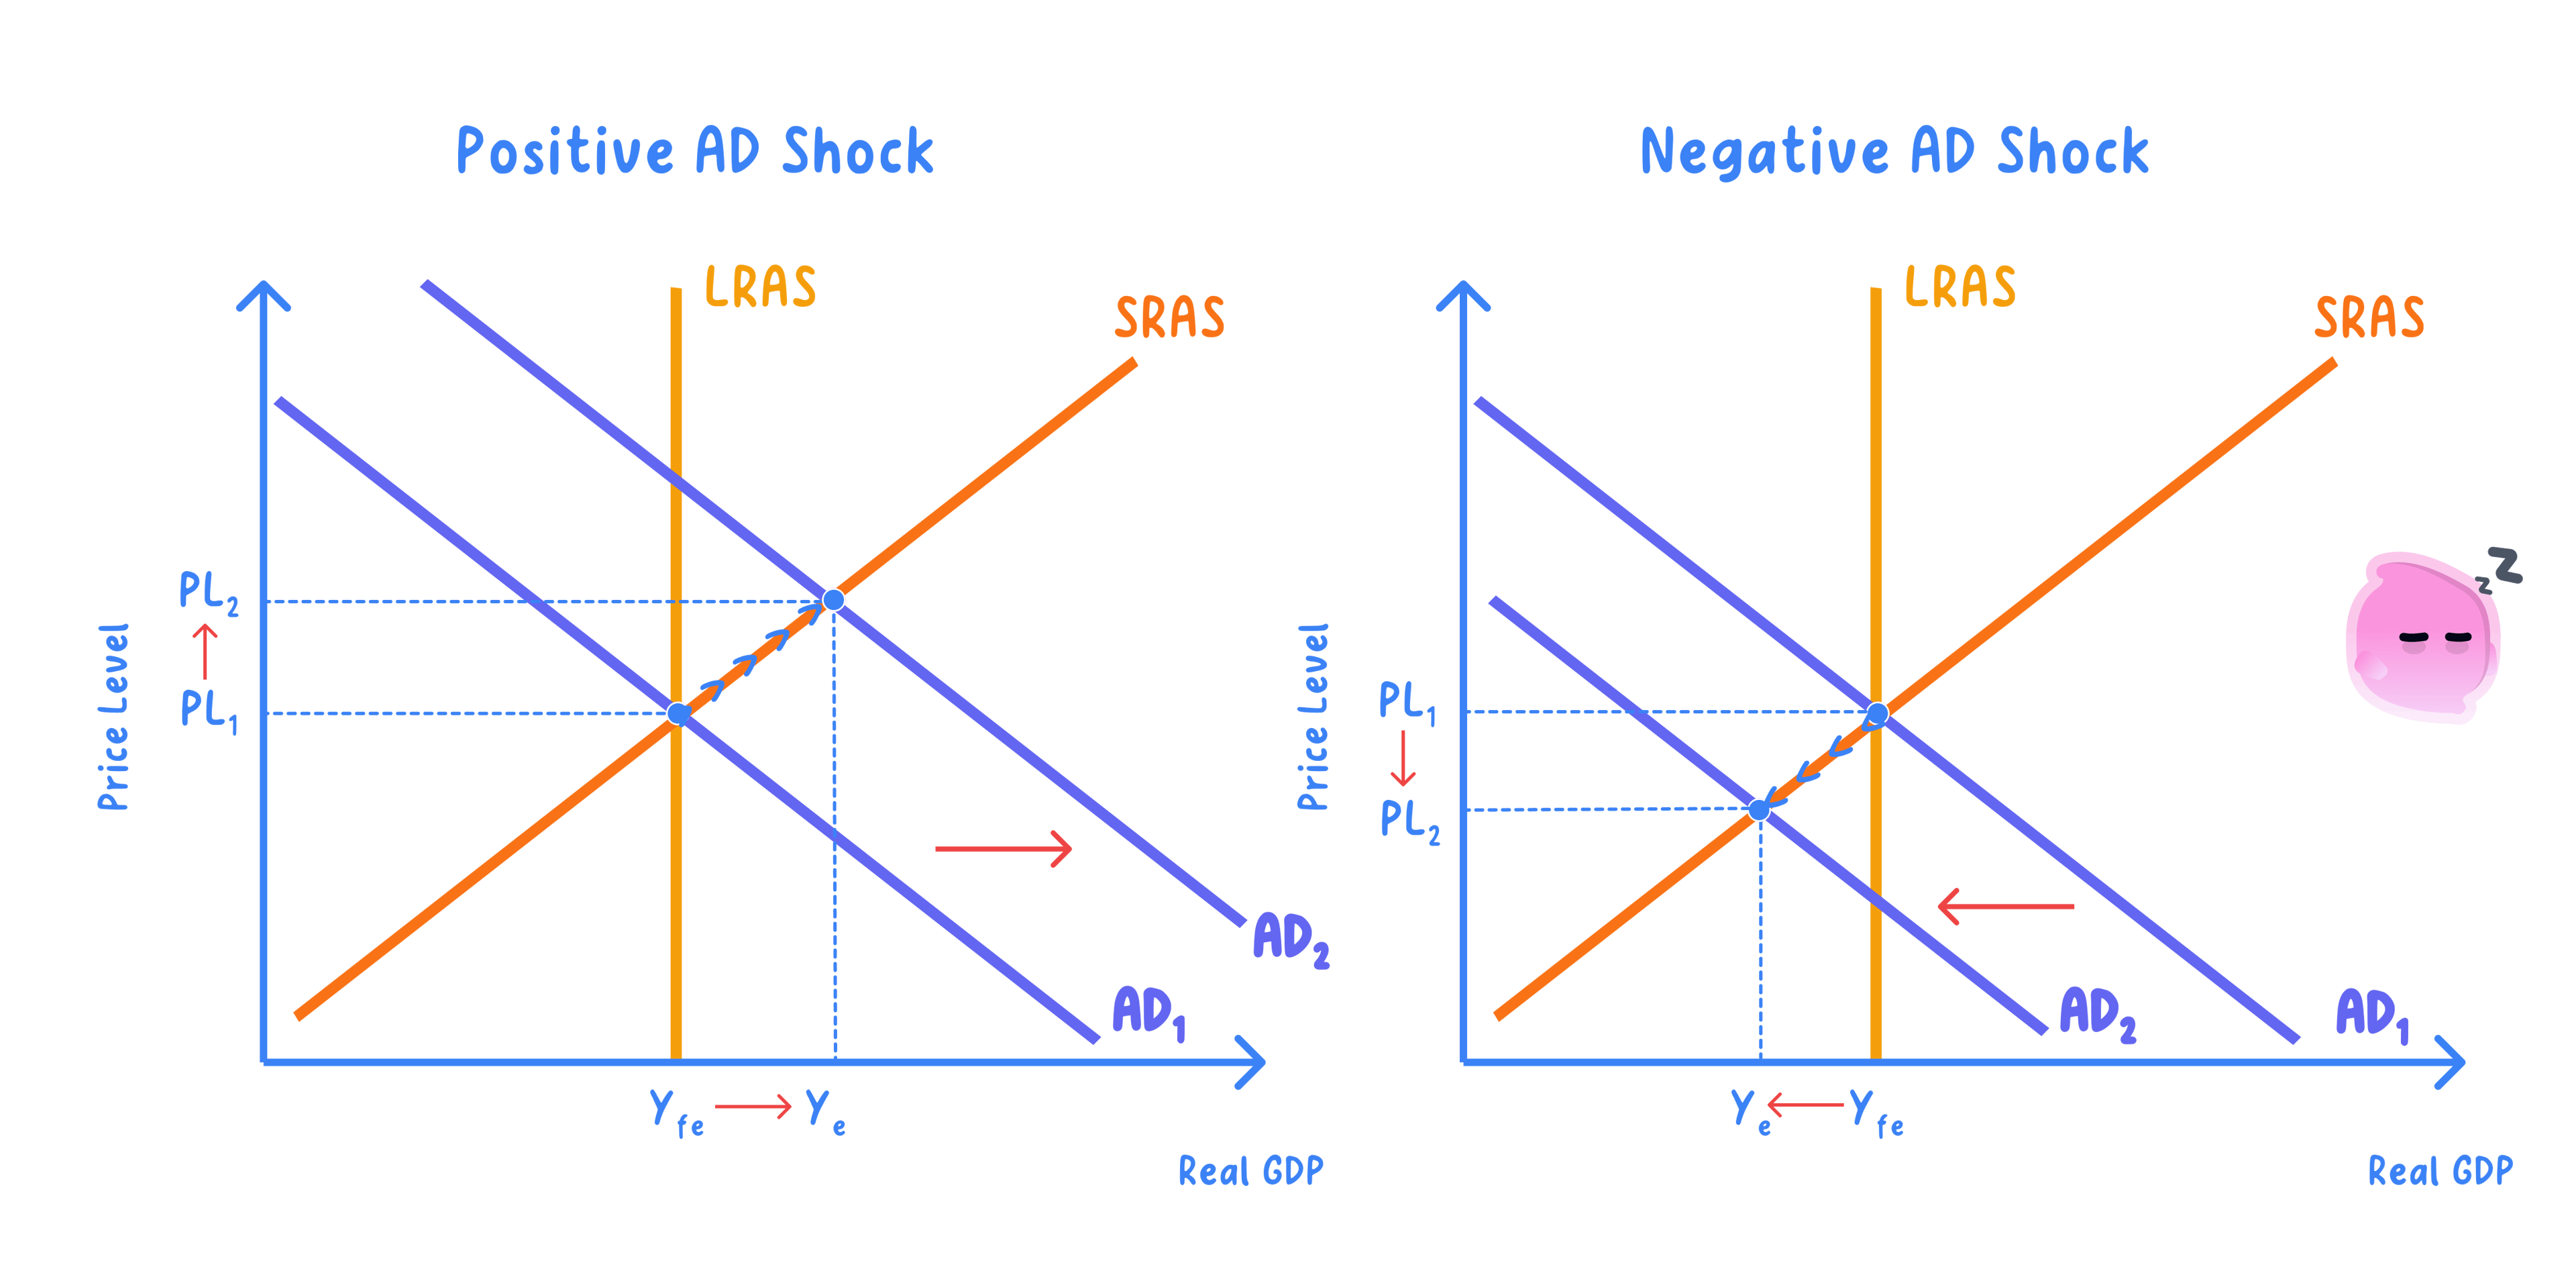
- A rightward AD shift raises real output and employment, and pulls the price level up.
- A leftward AD shift lowers real output and employment, and eases the price level down.
- So an AD shift moves output and the price level in the same direction.
Definition
Demand-pull inflation: a sustained rise in the average price level caused by aggregate demand growing faster than aggregate supply.
Example
- The central bank cuts the interest rate from 5% to 4% and confidence rises, so cheaper borrowing lifts consumption and investment by about £40bn.
- Total planned spending rises, so AD shifts to the right.
- Firms meet the extra orders by raising output from £2,000bn to £2,080bn and taking on more workers.
- Real output and employment rise, and the price index climbs from 100 to 104, which is demand-pull inflation.
Effects of an AS Shift
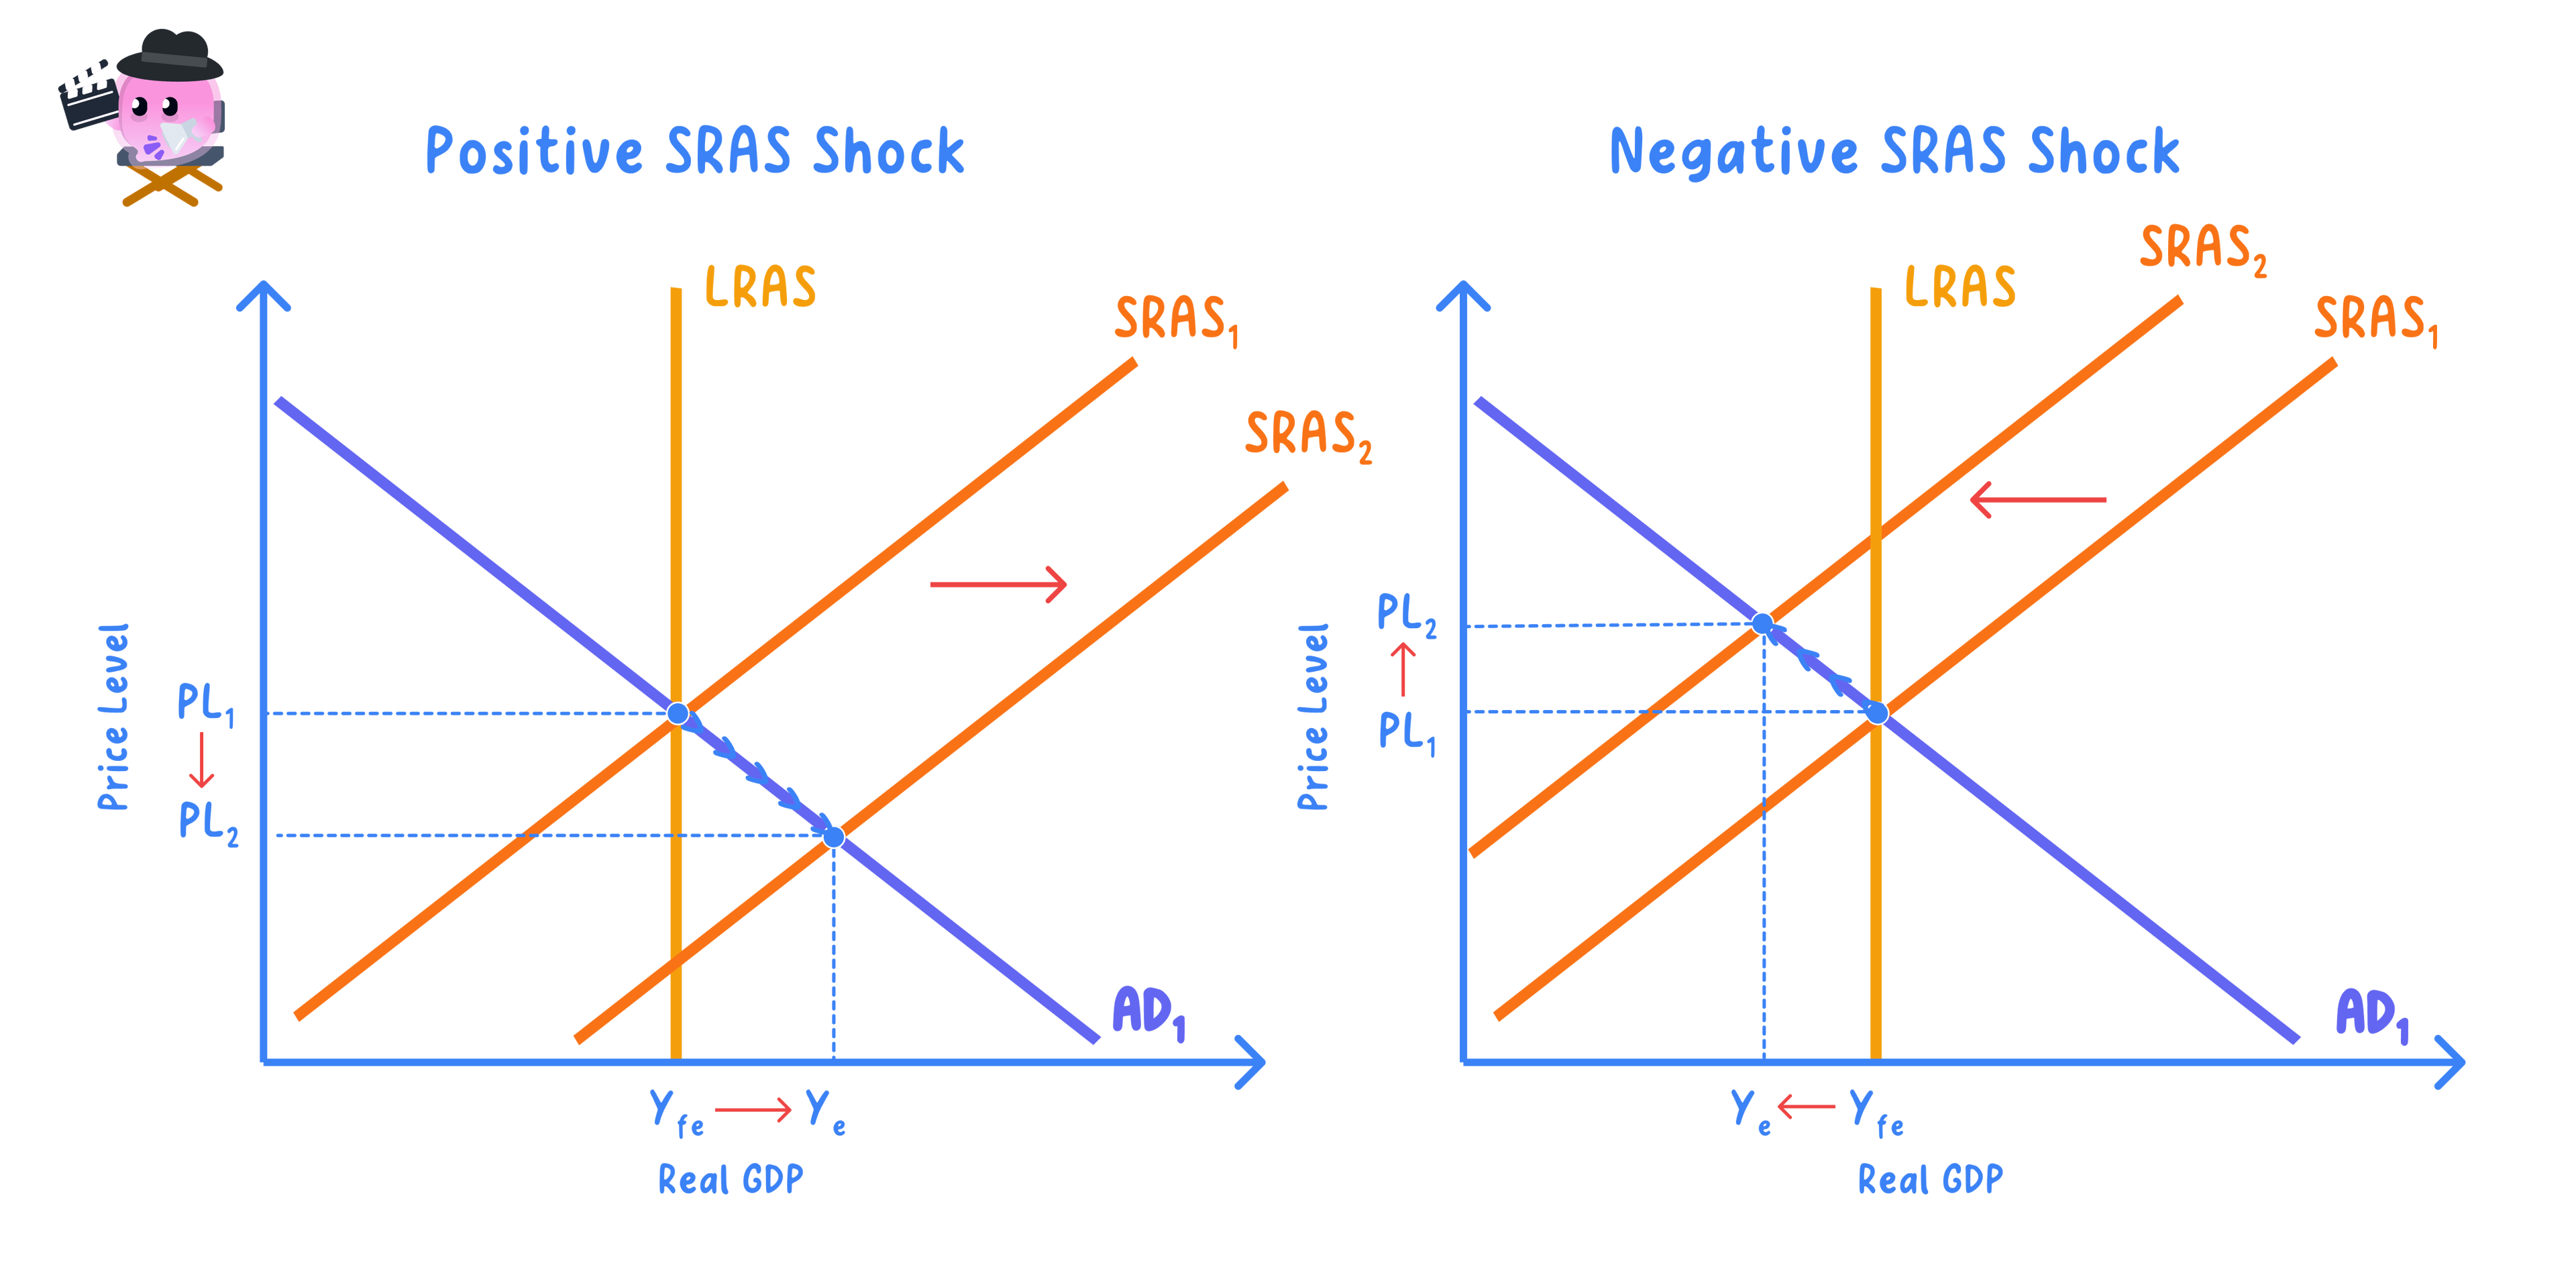
- A rightward AS shift raises real output and employment while easing the price level down.
- A leftward AS shift lowers output and employment while pushing the price level up.
- So an AS shift moves output and the price level in opposite directions.
Definition
Stagflation: the combination of falling or stagnant real output with a rising price level, typically caused by a leftward SRAS shift.
Example
- Oil rises from $70 to $120 a barrel, so energy and transport costs jump across the economy.
- At every price level firms can now supply less, so SRAS shifts to the left.
- Real output falls from £2,000bn to £1,940bn and unemployment rises, while the price index climbs from 100 to 106.
- Higher prices with lower output is stagflation, which is why a supply shock is harder to treat than a demand shock.
Why the Size Varies
- On the highly elastic section of AS, with much spare capacity, a rightward AD shift mainly raises output and employment.
- Near full capacity, the same AD shift mainly raises the price level, so growth gives way to inflation.
- So the effect depends on the shape of AS and the economy's starting point.
Note
- Time lags mean the full effect of a shift is not immediate.
- The same shift can have very different effects depending on spare capacity.
Combined Shifts
- AD and AS can shift at the same time, for example rising demand alongside falling costs.
- The output effects may reinforce each other while the price-level effects offset, so the net price change is ambiguous.
- So combined shifts must be analysed together, curve by curve.
How reliably does the model predict the size of the change?
- The model's directional predictions are robust: a rightward AD shift reliably raises output and the price level, and a leftward AS shift reliably produces stagflation, matching real episodes such as the oil-price shocks.
- The size of the change, though, is far less certain: how much of a shift shows up as extra output rather than higher prices depends on where the economy sits on AS, on the size of the shift, and on whether SRAS or LRAS has moved.
- Time lags, simultaneous shifts in both curves, and the fact that ceteris paribus rarely holds blur the picture further, so the model gives a tendency rather than a precise forecast.
- On balance the AD/AS model is a strong guide to the direction of the change but a weaker guide to its magnitude, so its reliability depends on the shape of AS and the economy's starting point: it is most useful for predicting whether output or prices move, and least useful for predicting by how much.
Exam technique
- State the effect on real output, on the price level and on employment separately.
- Remember that a rightward AS shift tends to lower the price level.
- Condition the size of the effect on the shape of AS and the starting point.
Common Mistake
- Do not assume the price-level effect is the same for AD and AS shifts.
- A rightward AD shift raises the price level, while a rightward AS shift tends to lower it.
Self review
- What does a rightward AD shift do to output, employment and the price level?
- What does a rightward AS shift do to the price level?
- What does a leftward AS shift do to output and prices?
- Why does the size of the effect depend on the AS shape?
