Shifts And Equilibrium
- A shift in demand or supply is caused by a change in a non-price determinant, not by a change in the good's own price.
- Once a curve shifts, the old price no longer clears the market, so price and quantity adjust to a new equilibrium.
- Working through one curve at a time reveals the direction of change in both equilibrium price and equilibrium quantity.
Demand Shifts
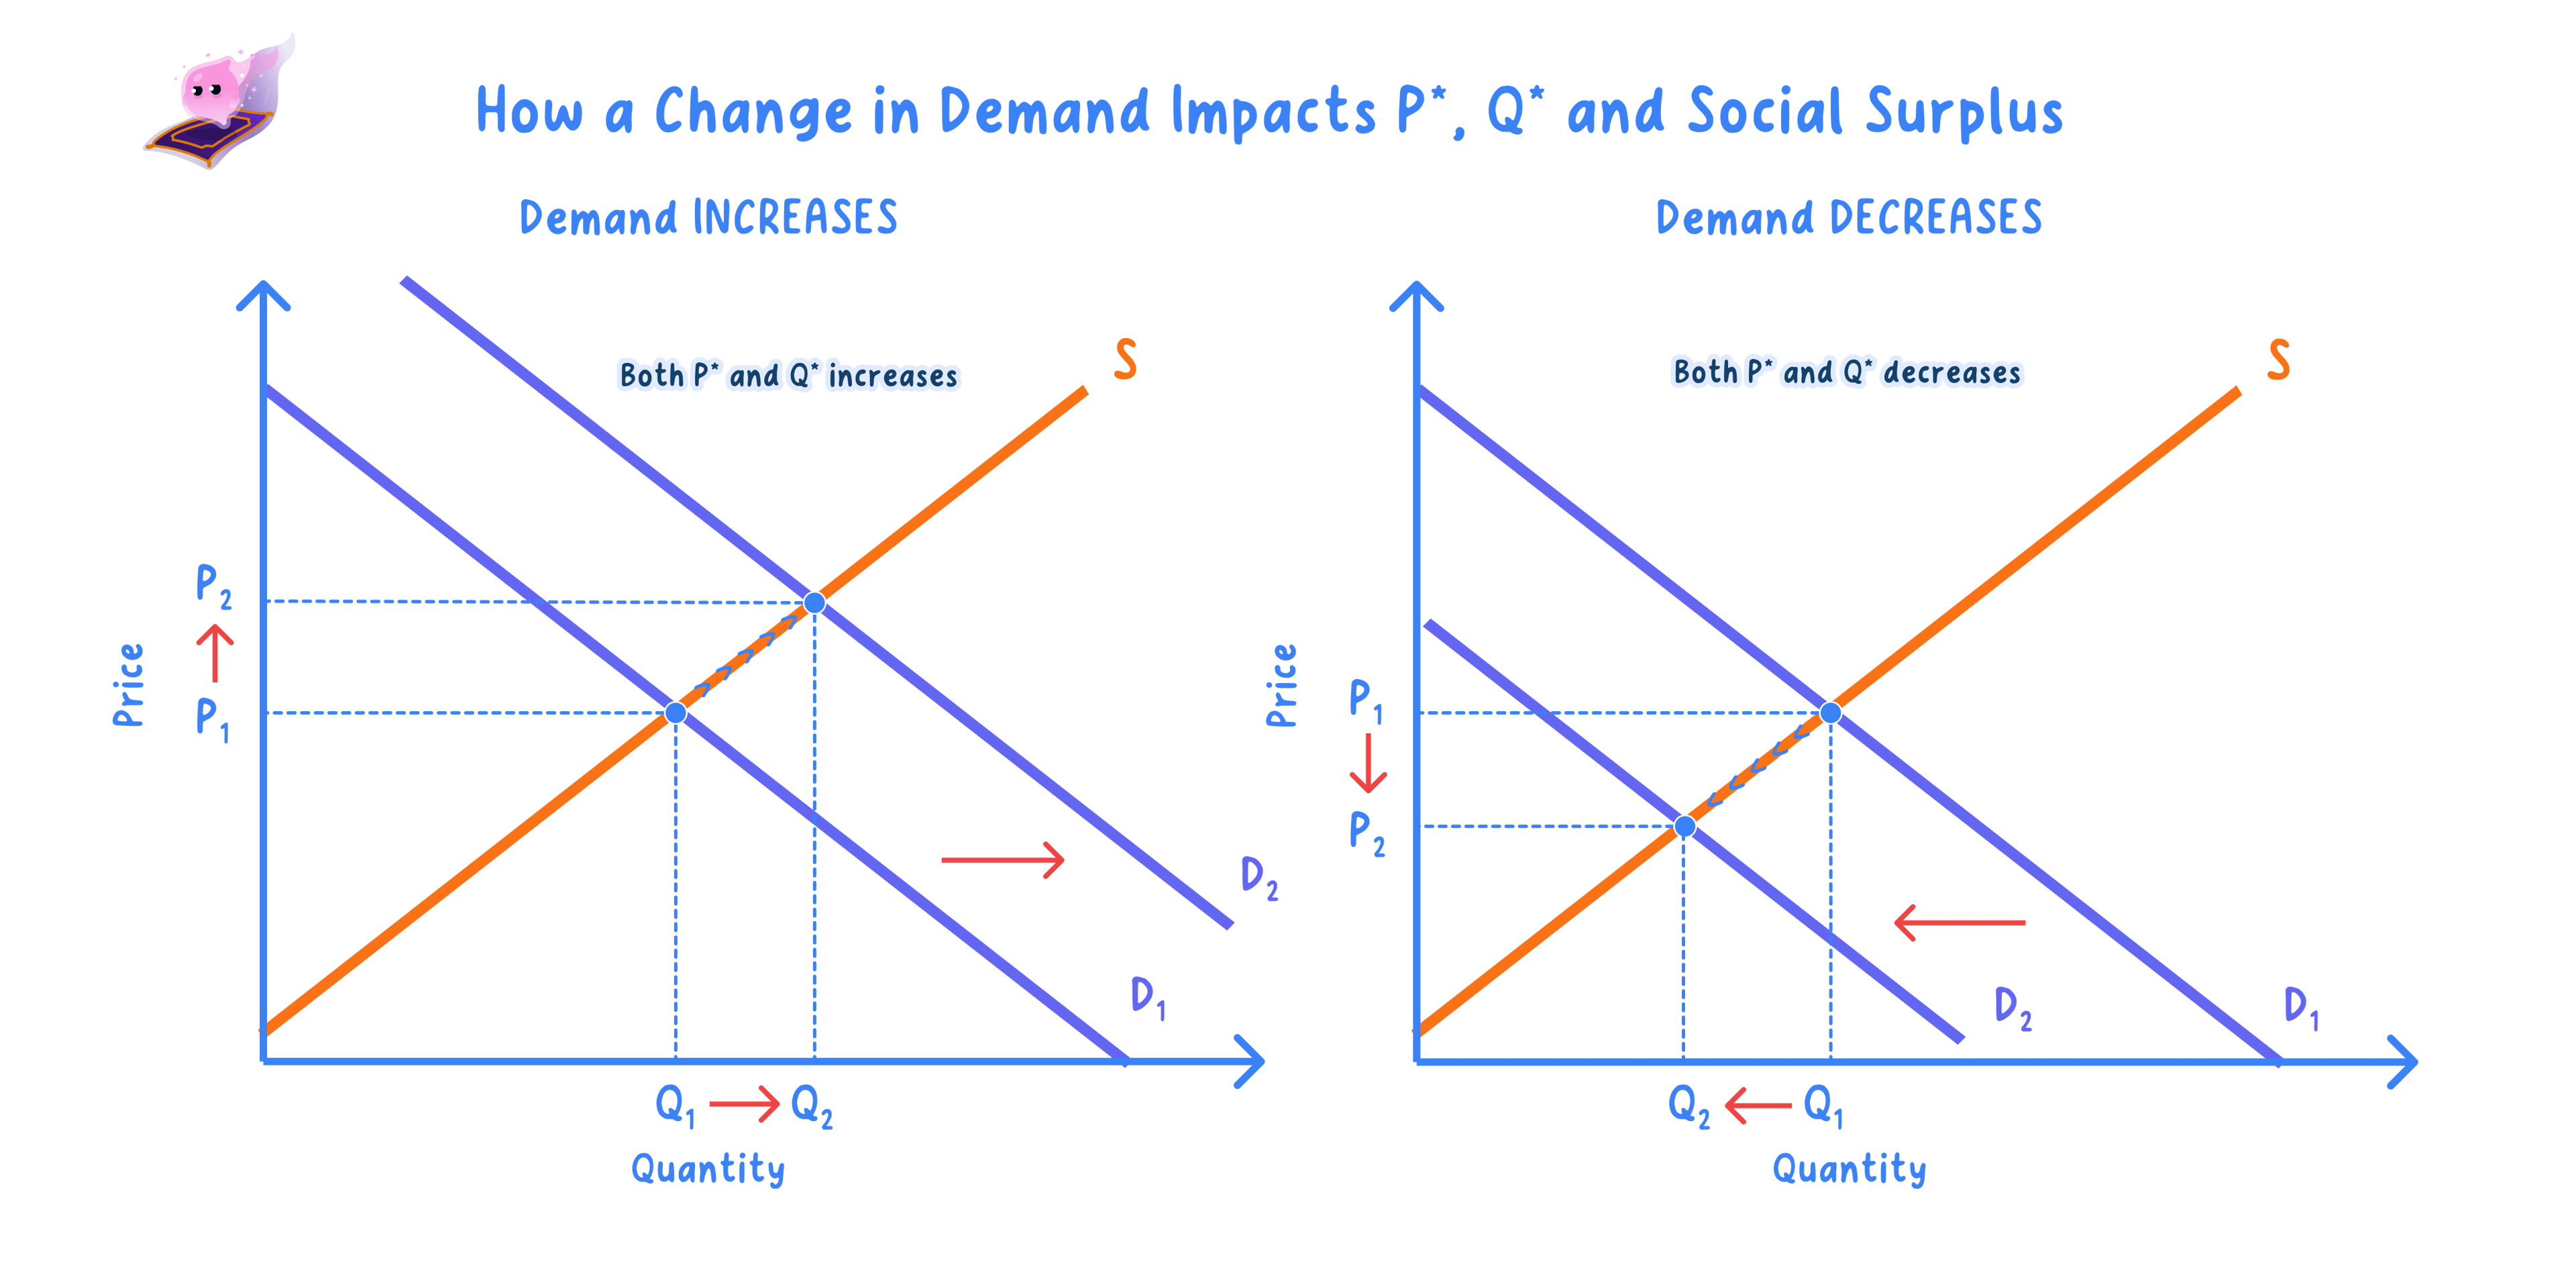
- A rightward shift in demand raises both equilibrium price and equilibrium quantity.
- Higher demand creates a shortage at the old price, so price is bid up and quantity supplied expands along the supply curve.
- A leftward shift in demand lowers both equilibrium price and equilibrium quantity, as a surplus at the old price forces price down.
Example
- Suppose coffee starts at an equilibrium price of £4 per cup, with 1,000 cups sold per day.
- A health report makes coffee more popular, shifting demand right so that at £4 buyers now want 1,300 cups.
- The shortage bids the price up to £5, where quantity settles at 1,150 cups, so both equilibrium price and quantity rise.
Supply Shifts
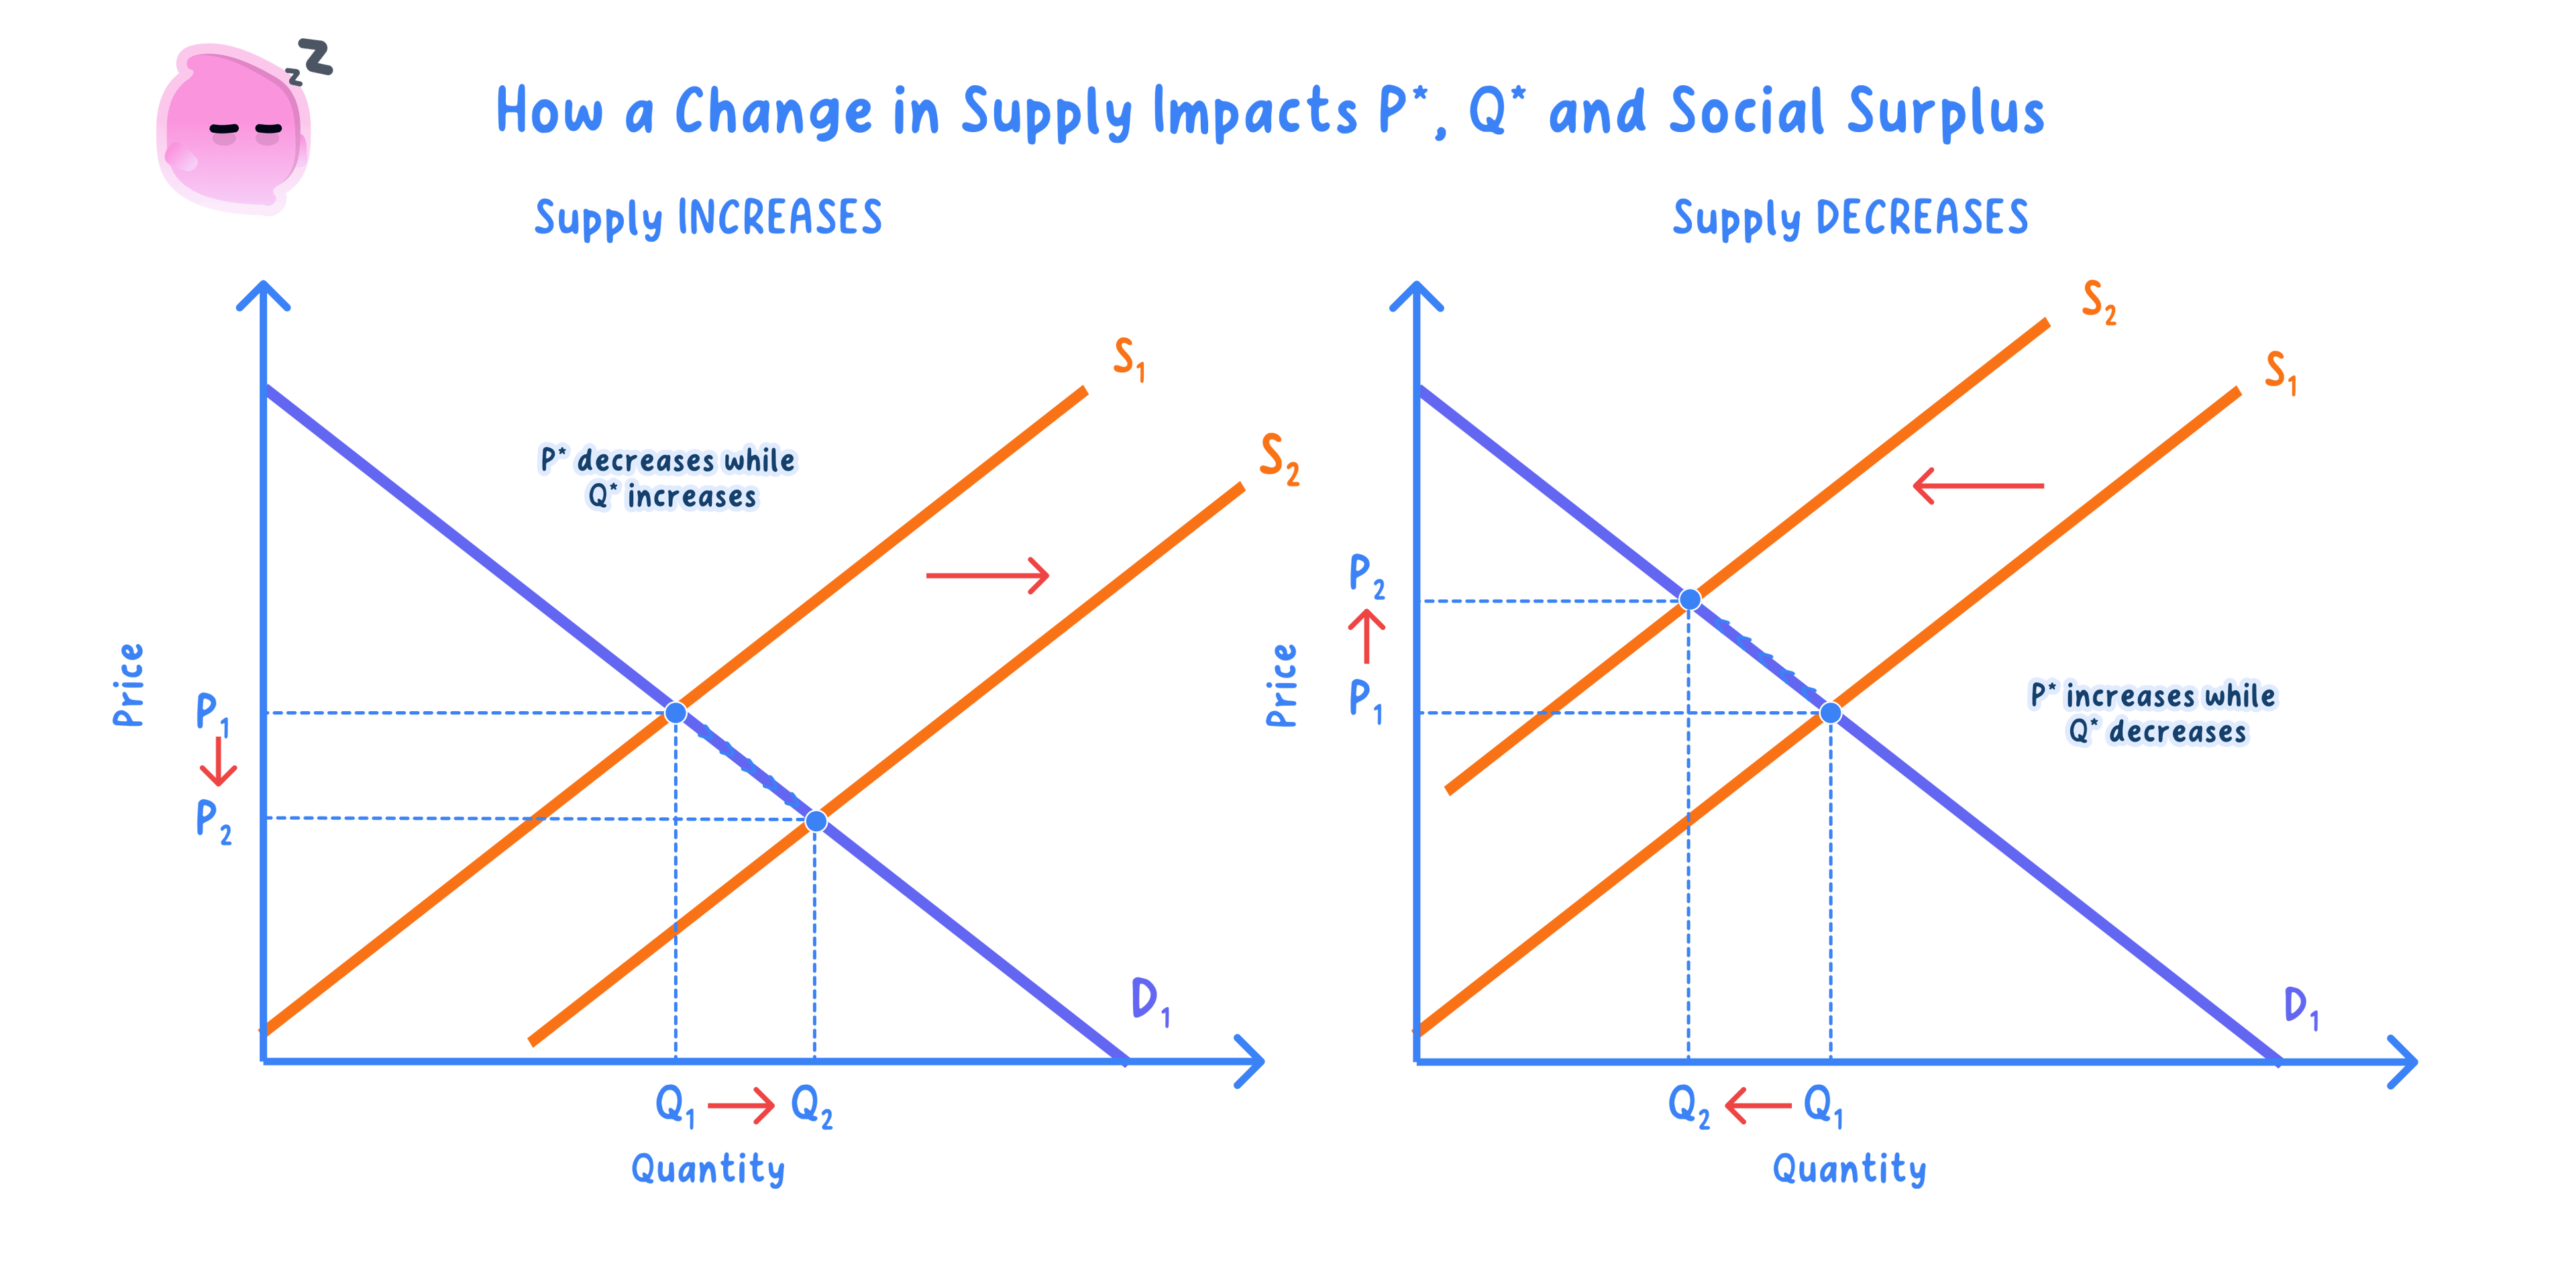
- A rightward shift in supply lowers equilibrium price but raises equilibrium quantity.
- Extra supply creates a surplus at the old price, so price falls until the larger quantity is bought.
- A leftward shift in supply raises equilibrium price but lowers equilibrium quantity, as a shortage at the old price bids price up.
Example
- Suppose wheat trades at an equilibrium price of £200 per tonne, with 500 tonnes sold.
- A drought shifts supply left, so at £200 farmers now offer only 350 tonnes.
- The shortage bids the price up to £260, where quantity settles at 420 tonnes, so equilibrium price rises and equilibrium quantity falls.
Combined Shifts
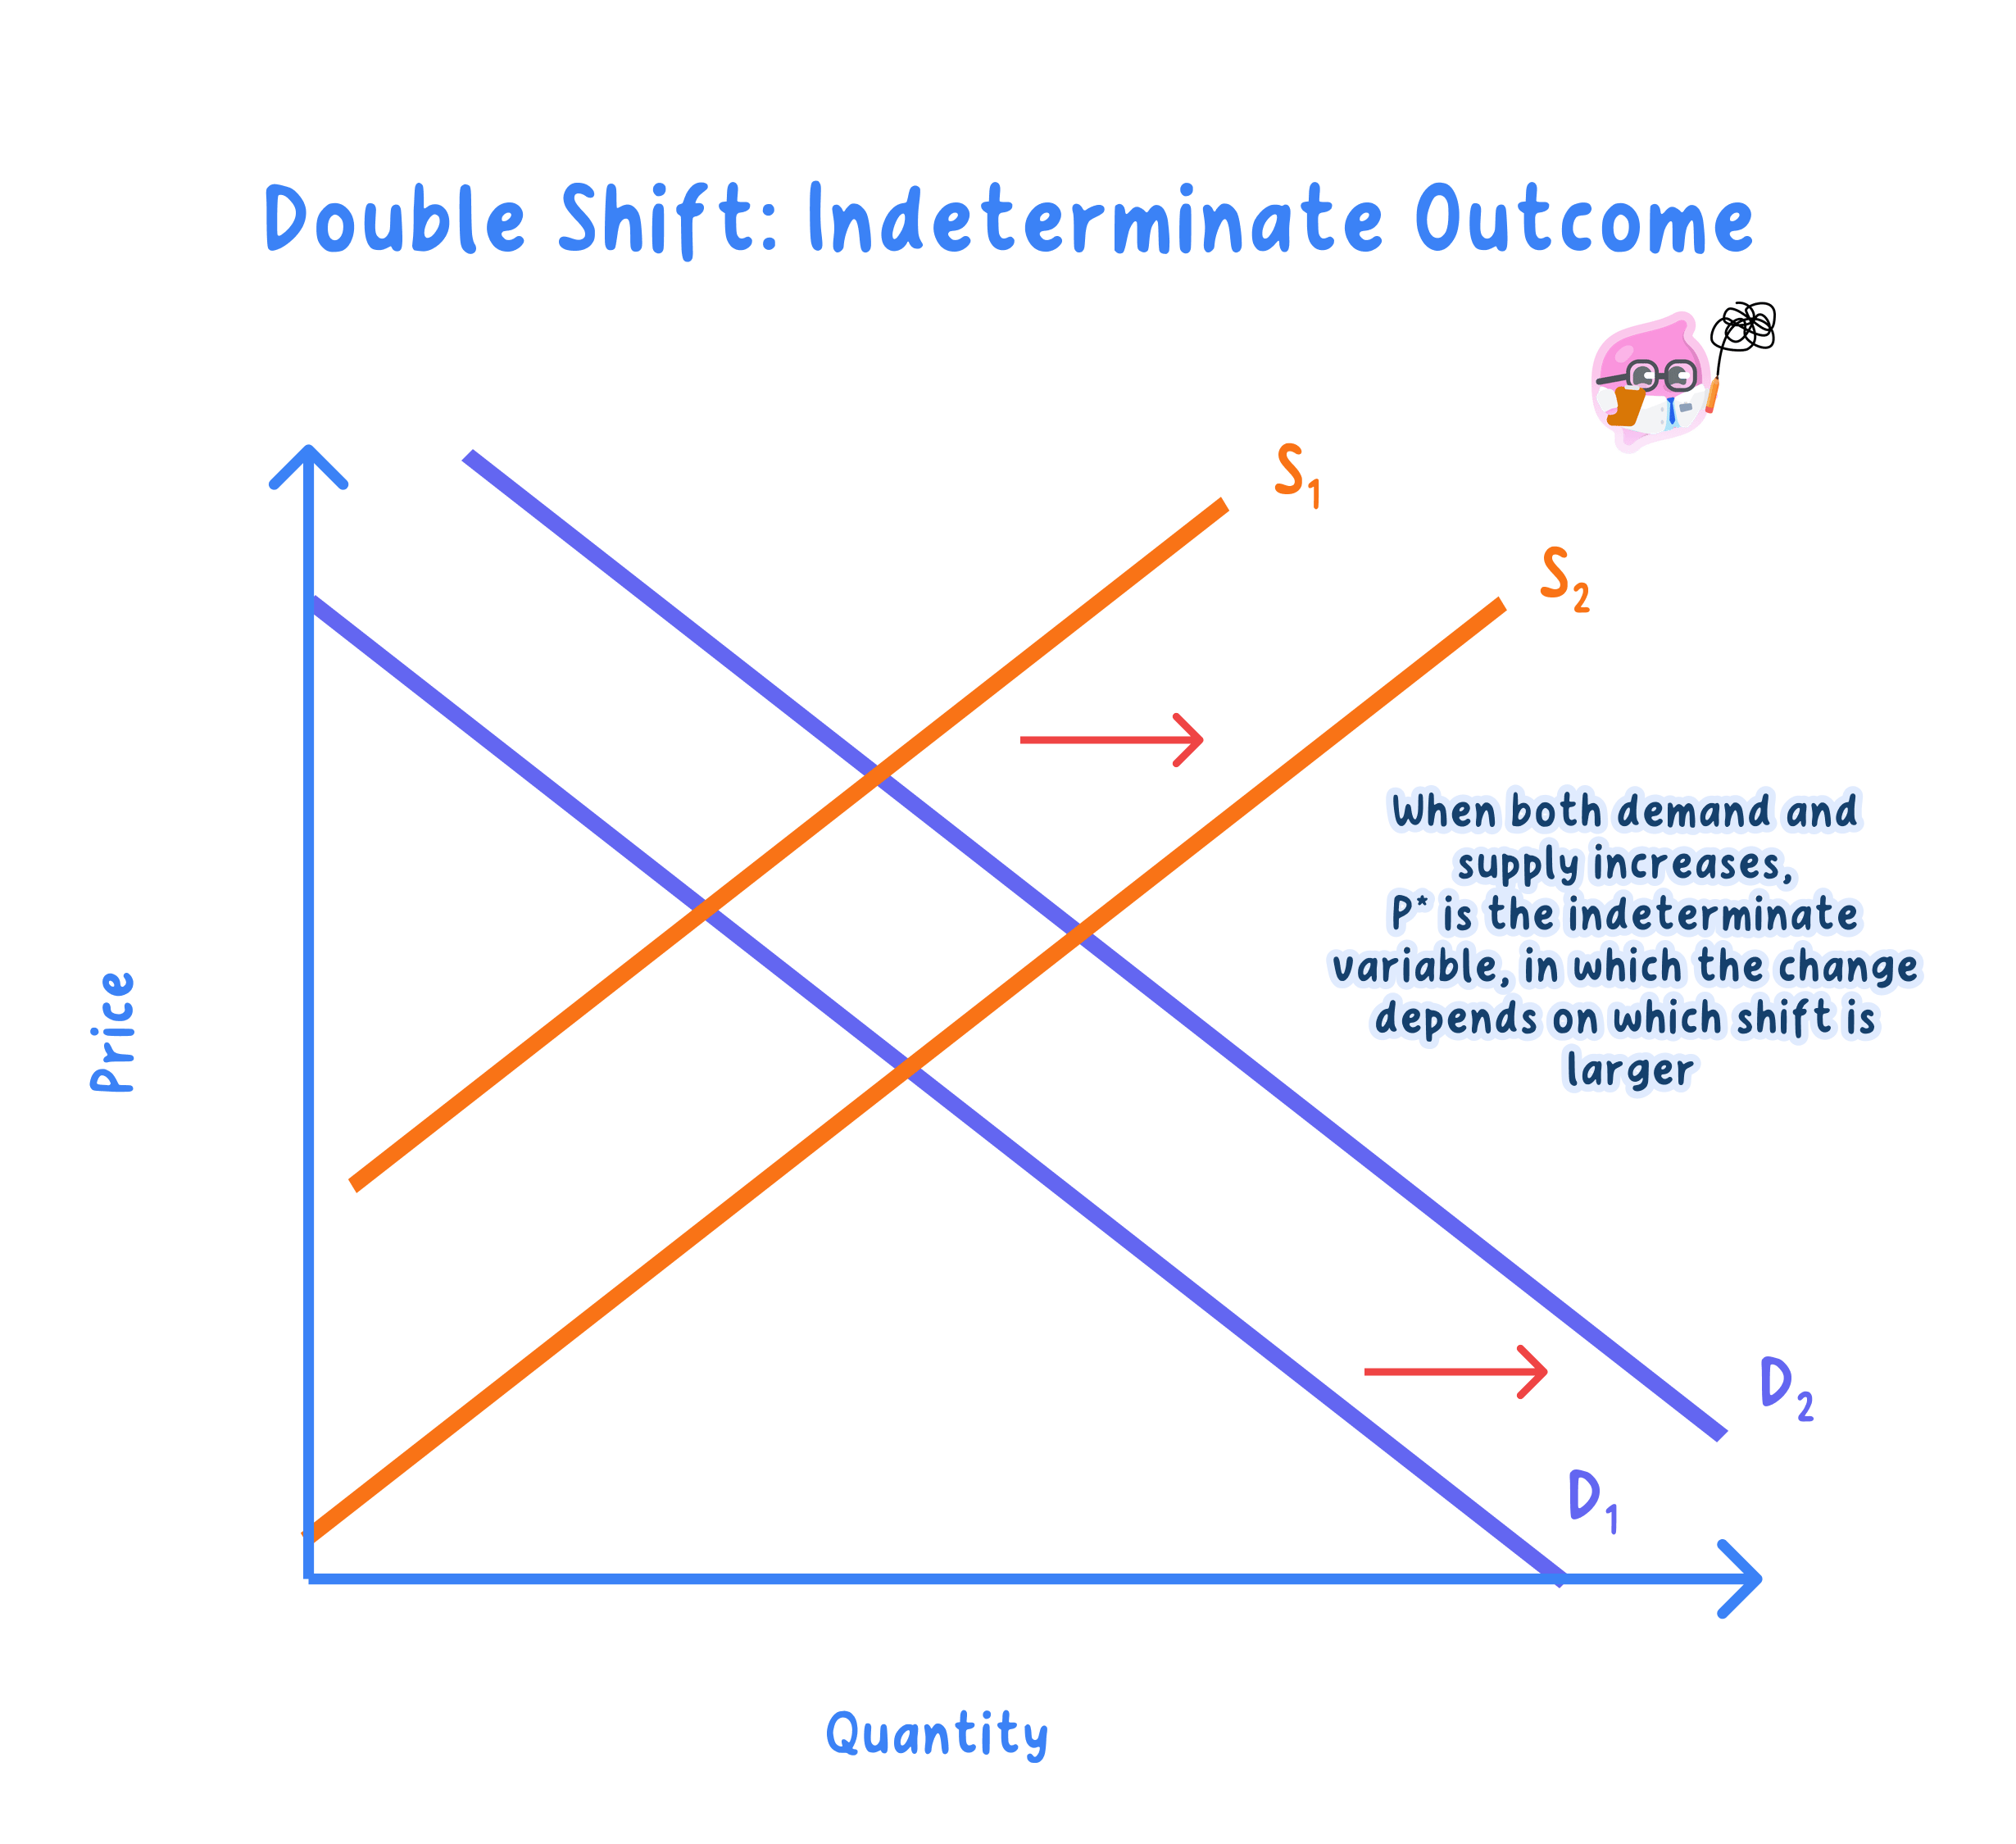
- When both curves shift, one of price and quantity can be determined but the other is often indeterminate.
- If demand and supply both rise, quantity clearly rises, but the price change depends on which shift is larger.
- The direction of the indeterminate variable can only be pinned down once the relative size of the two shifts is known.
Note
- Because new houses take years to build, housing supply is price inelastic, so a demand rise mainly raises price rather than quantity.
- In commodity and energy markets, inelastic short-run supply means a poor harvest or a supply disruption causes a large price spike for the same reason.
Elasticity And Volatility
- The size of the price and quantity change depends on the price elasticity of demand and supply, not just the direction of the shift.
- If supply is inelastic, a demand rise causes a large price change and only a small quantity change.
- The basic model captures the main forces but leaves out speculation, expectations and government intervention, which also move real prices.
Do markets always return to equilibrium quickly?
- The model's great strength is self-correction: any shortage or surplus at the old price creates pressure that, through the price signal, moves the market to the new equilibrium with no one directing it.
- But real adjustment is often slow: prices can be sticky (menu costs, wage contracts and regulated tariffs), and supply lags mean quantity cannot respond at once, so disequilibrium can persist for months or years in markets such as housing.
- Expectations and speculation can also push price away from the fundamental equilibrium rather than towards it, and government controls such as price ceilings or floors can lock in a shortage or surplus indefinitely.
- On balance, competitive markets with flexible prices do tend back to equilibrium, but how quickly depends on the context: the stickier the price and the more inelastic and slow-moving supply, the longer the adjustment, so the model is a reliable guide to the direction of change but not always to its timing.
Exam technique
- Move one curve first, read off the new equilibrium, then add the second shift if the question needs it.
- State clearly which of price and quantity is indeterminate for combined shifts.
- Bring in elasticity to judge the size of the change and support it with a real market.
Common Mistake
- Do not shift both curves at once carelessly; handle one shift at a time, then combine and identify what becomes indeterminate.
- Do not ignore elasticity, since the same shift has very different effects on price and quantity depending on it.
Self review
- How does a rightward shift in demand affect equilibrium price and quantity?
- How does a rightward shift in supply affect equilibrium price and quantity?
- Why can a combined shift leave price indeterminate?
- Why does inelastic supply lead to volatile prices?
- Give one factor the basic demand and supply model leaves out.
