Market Equilibrium
Definition
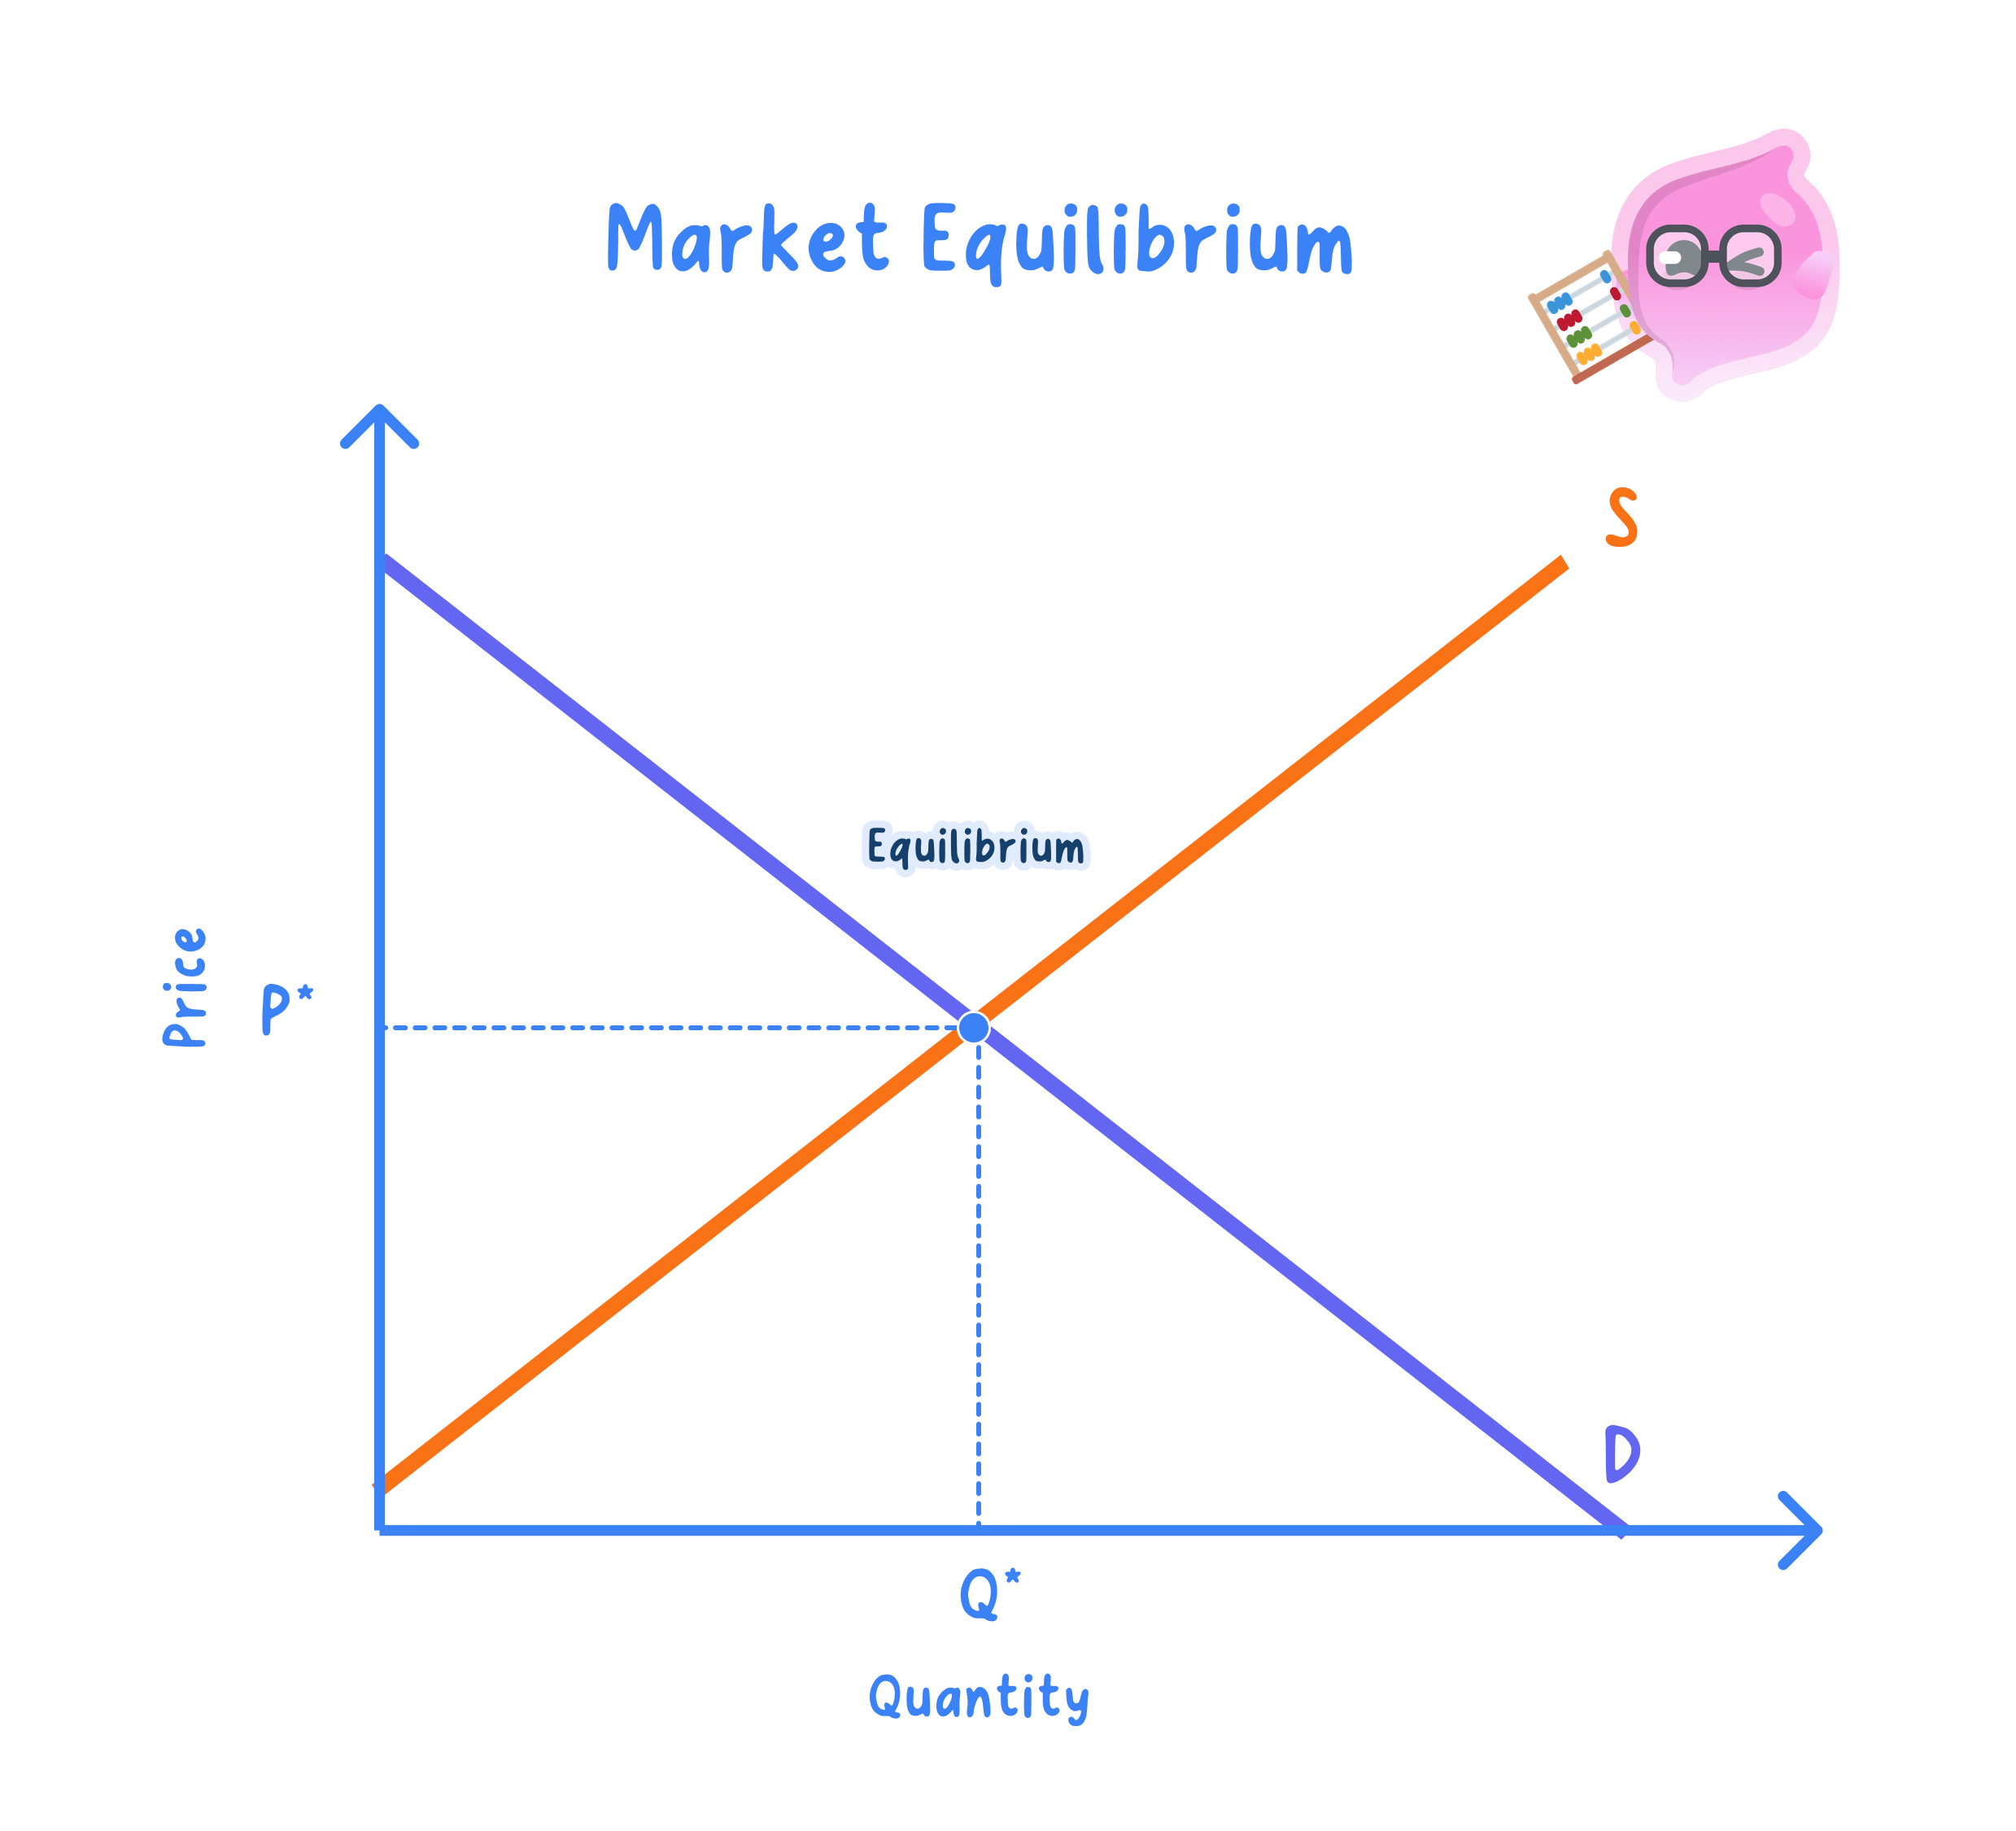
Market equilibrium: the price and quantity at which quantity demanded equals quantity supplied, leaving no tendency for the price to change.
Qd=Qs Q_d = Q_s Qd=QsDisequilibrium: any price at which quantity demanded and quantity supplied are unequal, producing either excess demand or excess supply.
Qd≠Qs Q_d \ne Q_s Qd=Qs- At the equilibrium price the market clears, so every unit offered for sale is bought and no buyer willing to pay that price goes without.
- It is found where the demand curve and supply curve intersect, with price on the vertical axis and quantity on the horizontal axis.
- At any other price the market is in disequilibrium, showing either excess demand or excess supply.
- Market forces then push the price back towards equilibrium until the imbalance disappears.
Excess Demand And Supply
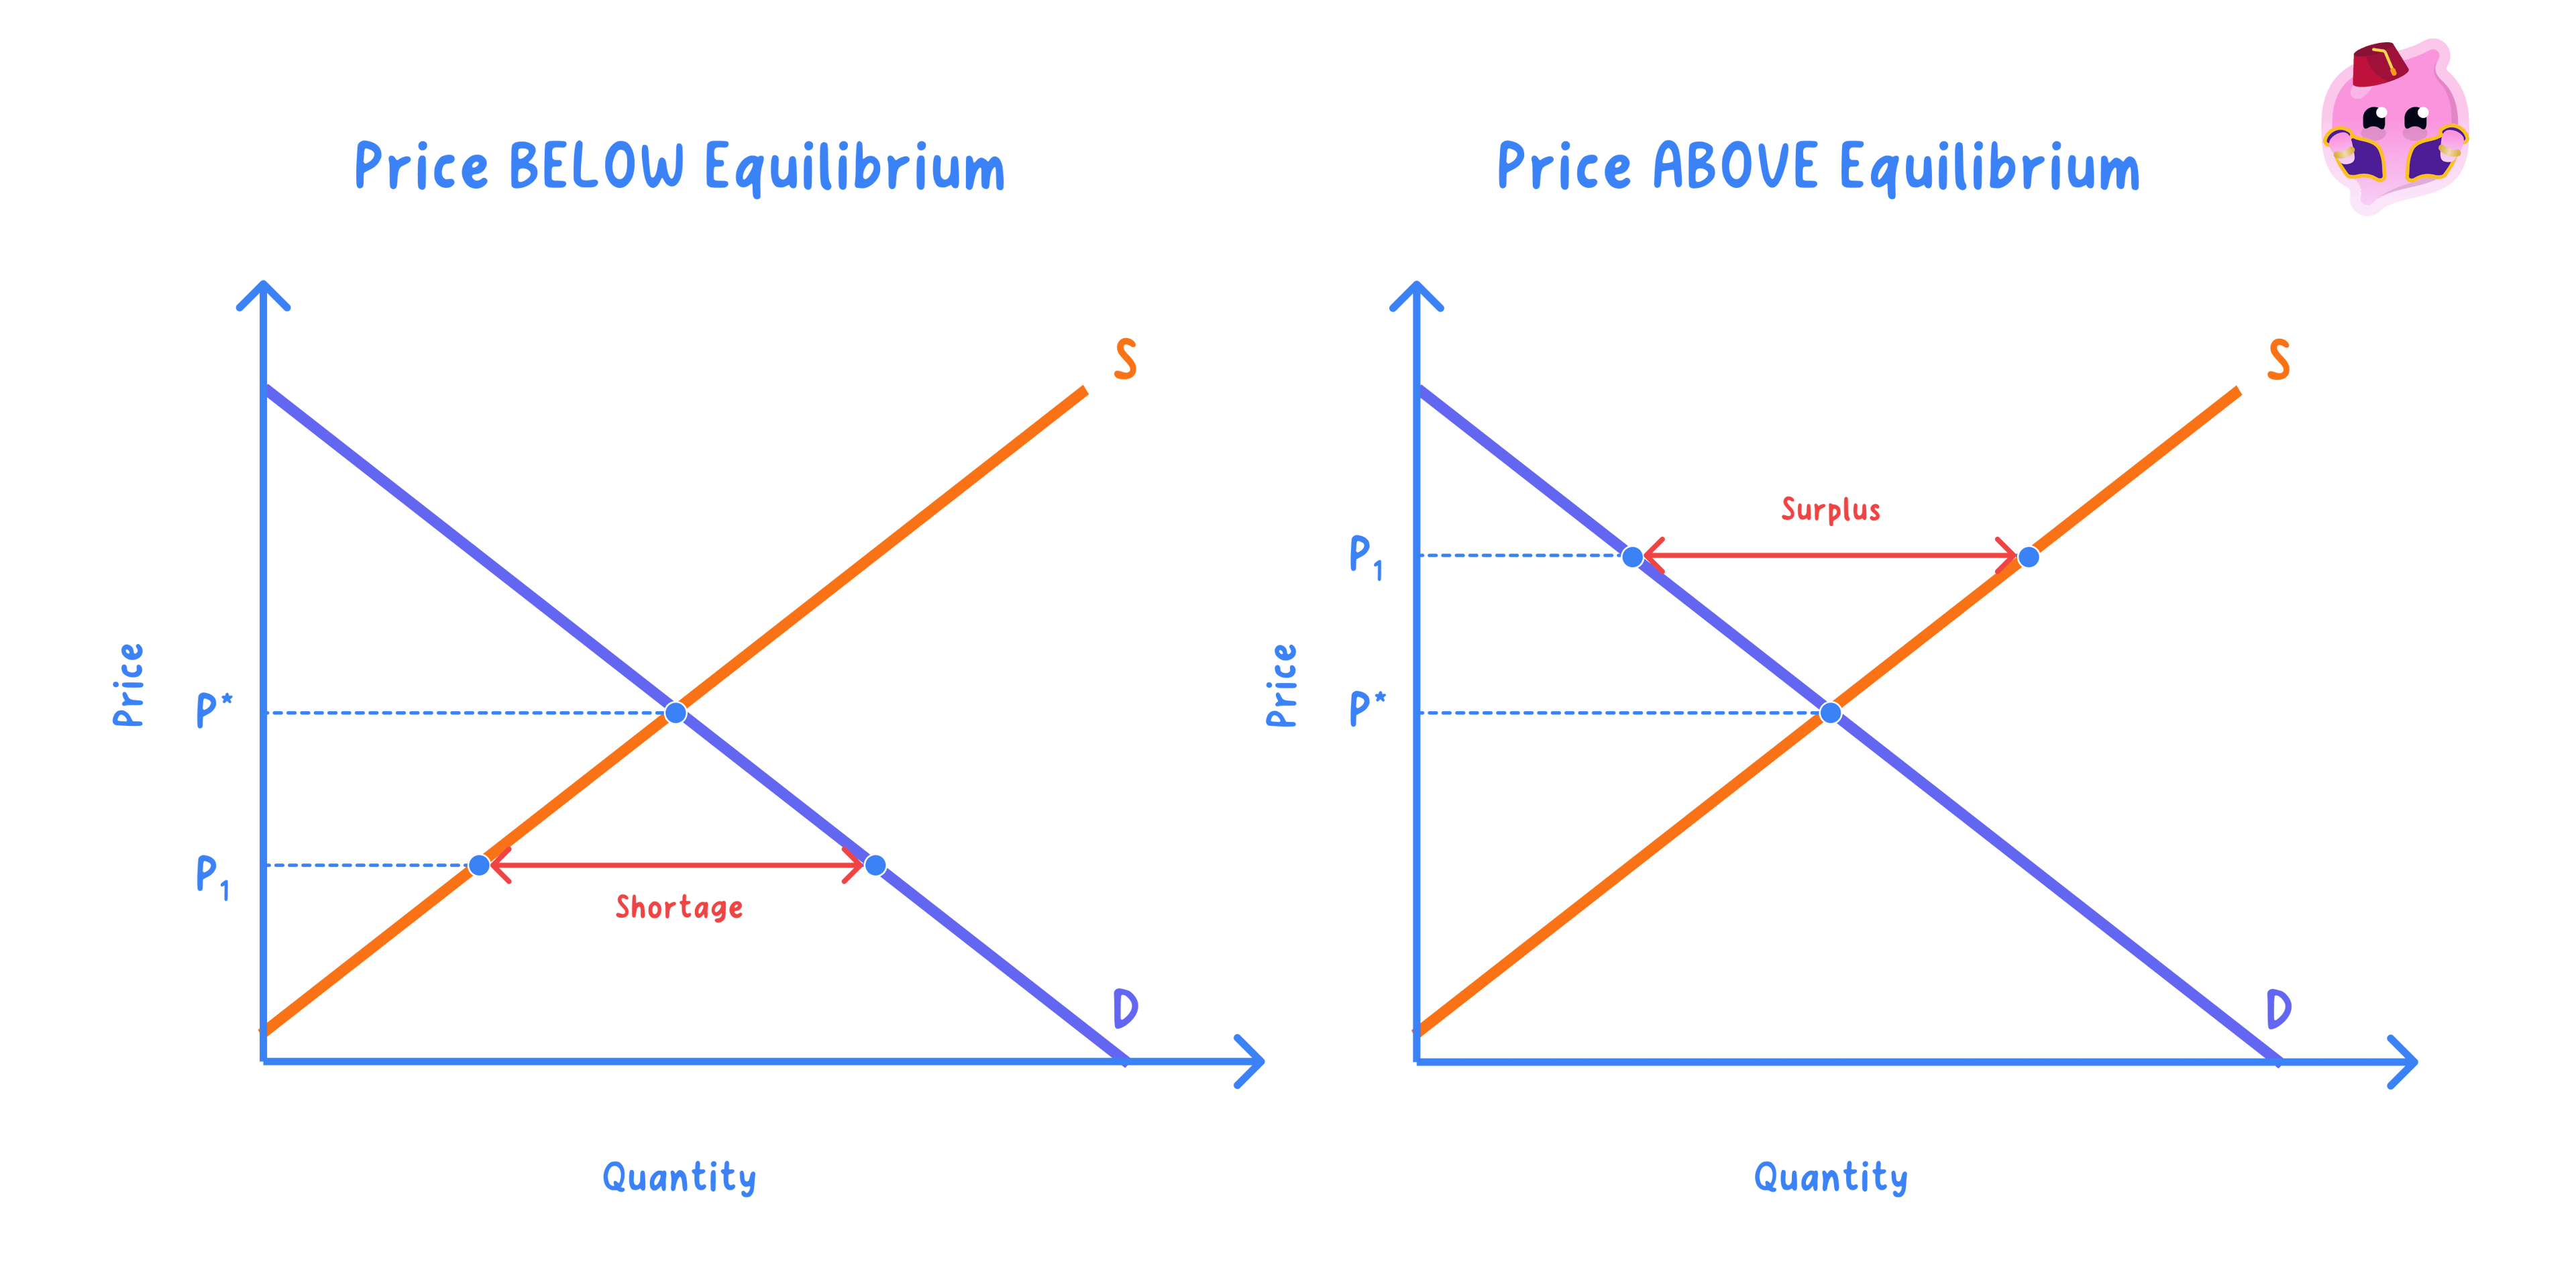
- Excess demand, or a shortage, exists when the price is set below equilibrium.
- Quantity demanded exceeds quantity supplied, so unsatisfied buyers bid the price up.
- Excess supply, or a surplus, exists when the price is set above equilibrium.
- Quantity supplied exceeds quantity demanded, so sellers cut the price to clear unsold stock.
Example
- Suppose the equilibrium price of rice is £2 per kg, with 100 tonnes bought and sold each day.
- If the price is held at £1, quantity demanded rises to 140 tonnes while quantity supplied falls to 60 tonnes.
- This leaves excess demand of 80 tonnes, so buyers bid the price up towards £2 until the shortage is removed.
Adjustment To Equilibrium
- A shortage lets sellers raise the price, which draws out more supply and chokes off some demand.
- A surplus forces sellers to lower the price, which raises quantity demanded and discourages supply.
- These forces continue until quantity demanded once again equals quantity supplied and the price settles.
Note
- The marks are in the adjustment process, not in merely stating that a shortage or surplus exists.
- Always explain how the price change removes the excess and restores equilibrium.
Speed Of Adjustment
- In flexible markets prices adjust quickly, so equilibrium is restored fast.
- Where prices are sticky, such as wages, disequilibrium can persist for a long time.
- A price held below equilibrium can lock in a shortage and stop the market clearing at all.
Exam technique
- Define equilibrium as quantity demanded equal to quantity supplied before you draw anything.
- For disequilibrium, explain how price adjustment removes the shortage or surplus.
- Draw price on the vertical axis and quantity on the horizontal axis, marking the excess clearly.
Common Mistake
- Do not just state that a shortage or surplus exists; explain how price adjusts to restore equilibrium.
- Do not confuse a shortage with scarcity, which is the permanent problem of limited resources, not a disequilibrium at one price.
Self review
- Define market equilibrium.
- What happens to price at a level below equilibrium?
- How does price remove a surplus?
- Why might a market fail to clear quickly?
- What is the difference between a shortage and scarcity?
