Shifts in supply
Definition
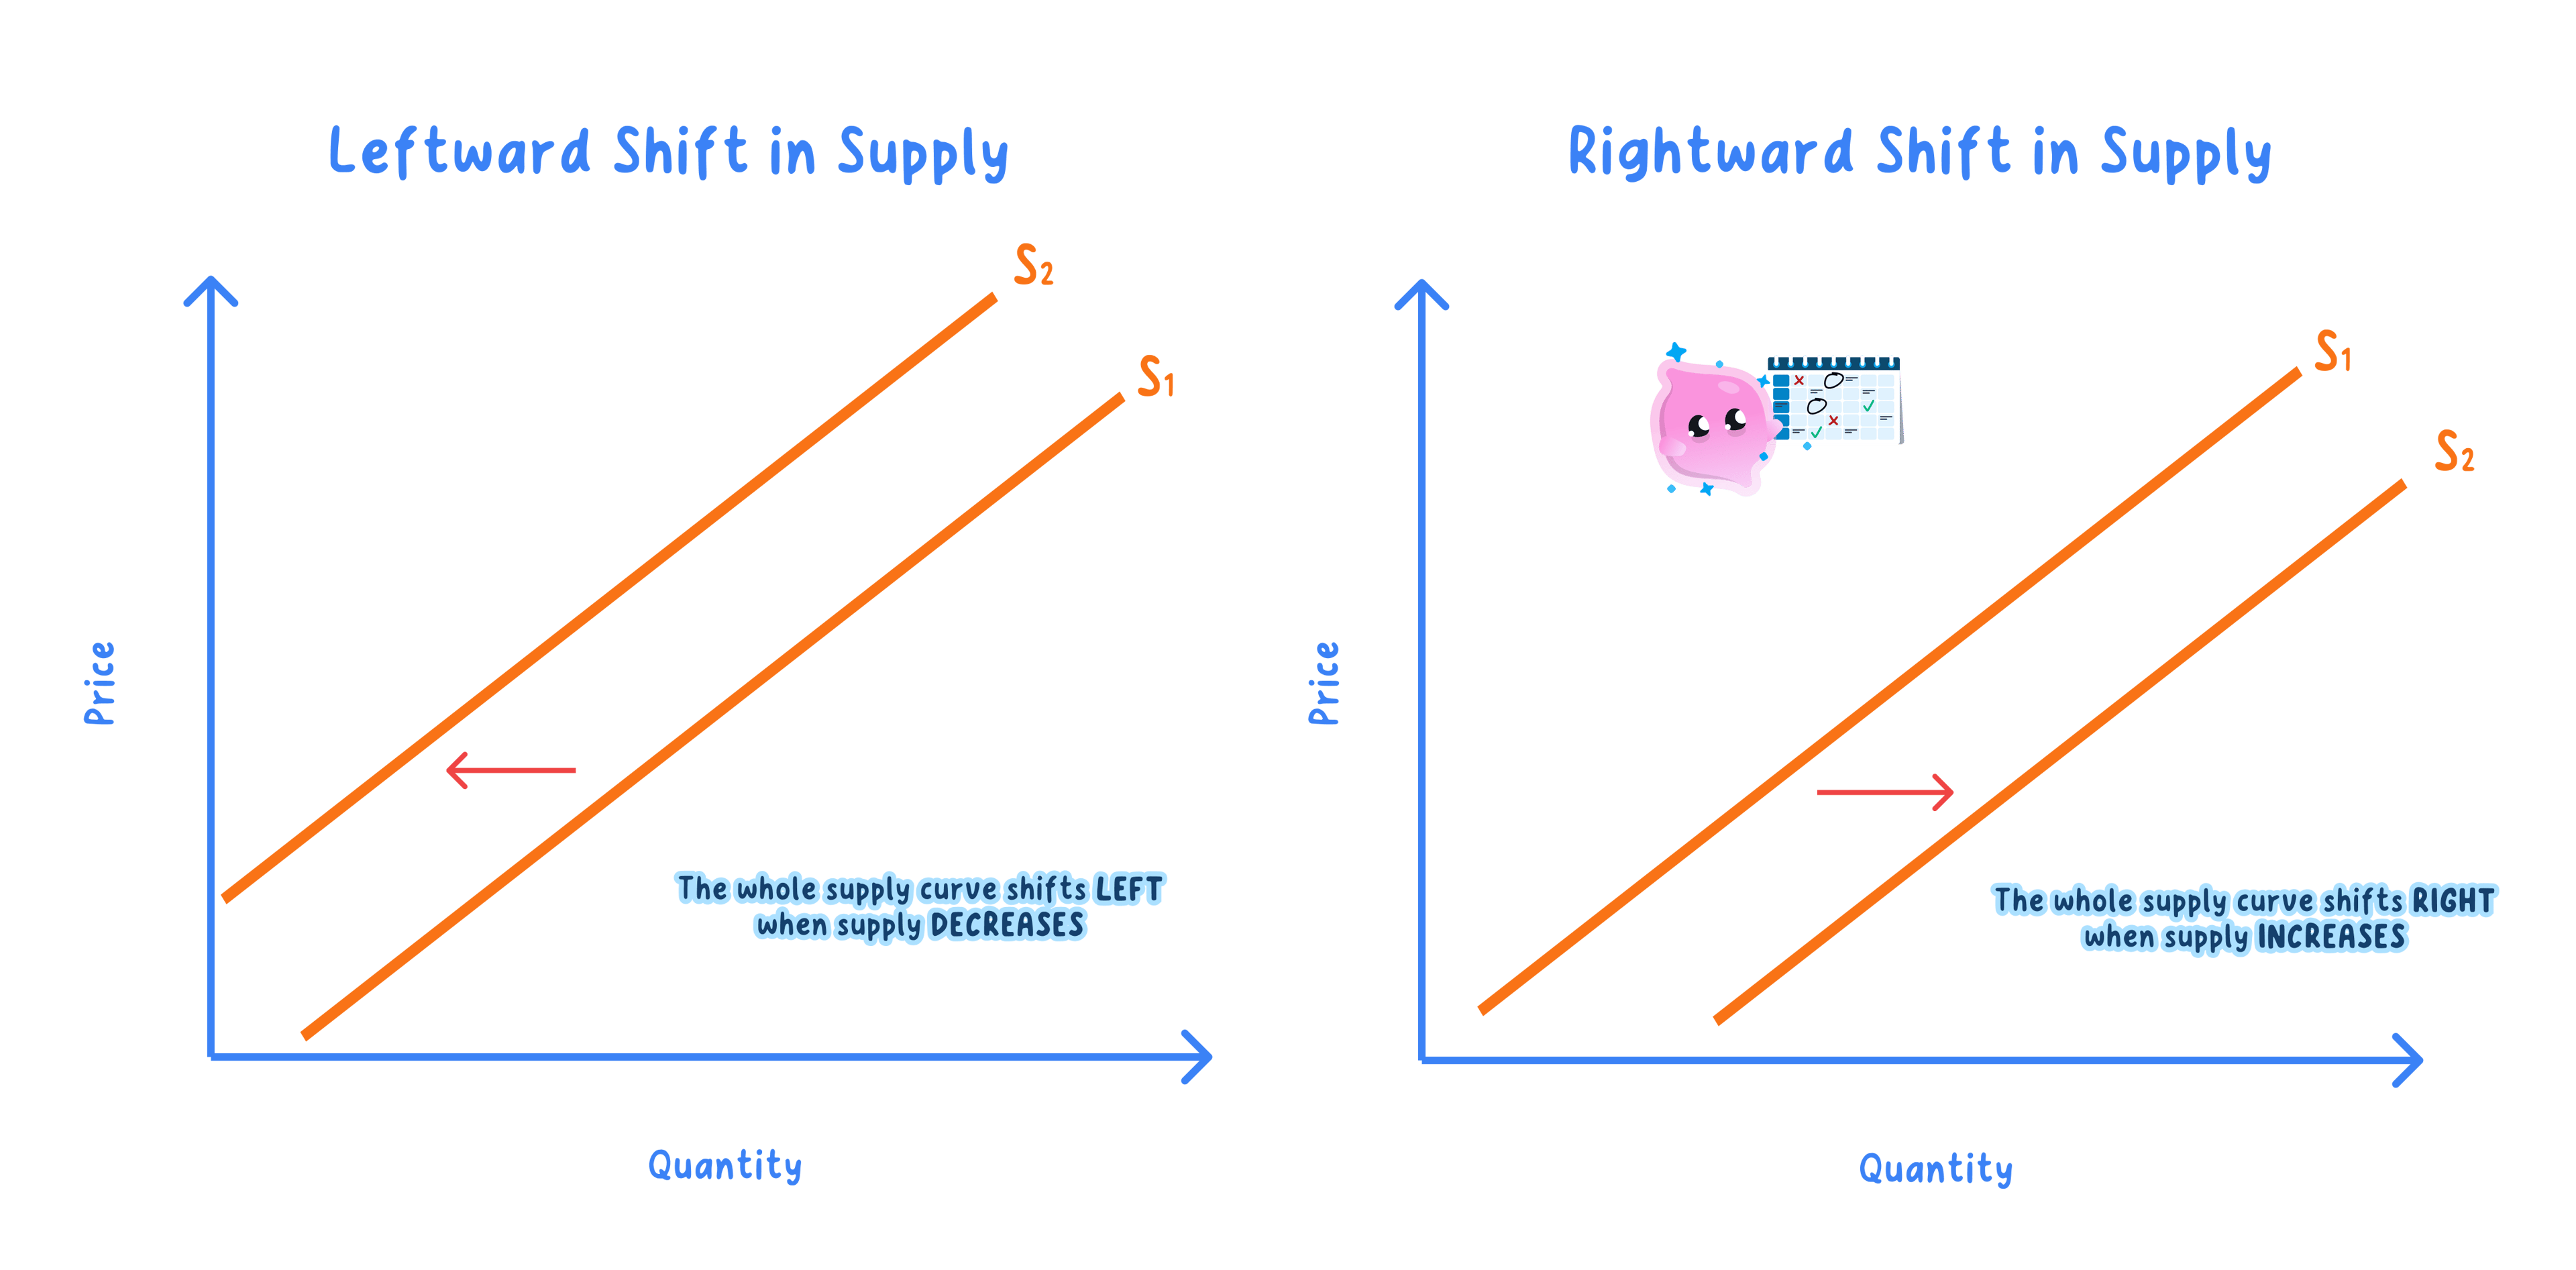
Shift in the supply curve: a change in the quantity supplied at every price, caused by a change in a condition of supply rather than the good's own price.
- At each price, producers choose how much to supply based on costs, technology, taxes and the other conditions of supply.
- If a condition changes so that supplying becomes more profitable, firms offer more at that same price, drawn as a rightward (+) shift.
- A change that makes supplying less profitable works in reverse, shifting the whole curve to the left (−).
- The good's own price is held constant throughout, so a condition change is a shift and never a movement along.
- At the original price the shift creates a surplus or shortage, which then pushes the market to a new equilibrium.
Key Idea
- A change in any condition of supply shifts the whole curve; a change in the good's own price only moves along it.
- A rightward shift means more is supplied at every price; a leftward shift means less.
Causes of the shift
- Costs of production: a +40% jump in natural-gas prices raises energy and fertiliser costs for a food manufacturer and shifts supply left, whereas cheaper inputs shift it right.
- Technology: automated packing lines in a warehouse raise output per hour and cut unit costs, so supply shifts right.
- Indirect taxes and subsidies: a duty of £0.50 per litre on soft drinks adds to unit costs and shifts supply left, whereas a £5,000 subsidy per electric van lowers them and shifts supply right.
- Prices of goods in competing supply: if maize becomes more profitable, farmers switch land from soybeans to maize, so the supply of soybeans shifts left.
- Number of firms: when new low-cost airlines enter a route, extra sellers add to total supply and shift the curve right; airlines exiting shift it left.
- Weather and other shocks: for primary goods a good growing season shifts supply right (+), whereas a drought or flood damages the crop and shifts it left (−).
Example
- The price of energy, a key input for a food manufacturer, falls sharply.
- Lower energy costs cut the cost of producing each unit.
- At each price the firm is now willing to supply more, so the supply curve shifts right.
- At the original price there is now a surplus, as quantity supplied exceeds quantity demanded.
- The surplus pushes the price down, so equilibrium price tends to fall and equilibrium quantity tends to rise.
Direction, size and duration
- A rightward shift tends to lower equilibrium price and raise quantity, while a leftward shift tends to raise price and lower quantity.
- Getting the direction wrong reverses the prediction, so identify it before drawing.
- The size of the shift depends on how much costs change, and its split between price and quantity depends on the price elasticity of demand: it depends on how sensitive buyers are.
- Duration matters too: technology gains tend to be permanent, whereas weather shocks are usually temporary.
Exam technique
- State which condition of supply changed and whether the curve shifts left or right.
- Never explain a shift by the good's own price.
- Carry the shift through to the new equilibrium price and quantity.
Common Mistake
- Do not explain a supply shift by the good's own price; an own-price change is a movement along the curve.
- Do not forget the prices of goods in competing supply; if another good becomes more profitable, supply of this one shifts left.
Self review
- What kind of change causes the supply curve to shift?
- Which way does better technology shift supply?
- Name four causes of a shift in supply.
- How does a leftward shift affect equilibrium price and quantity?
- How can the price of a good in competing supply shift this good's supply?
