Shifts in demand
Definition
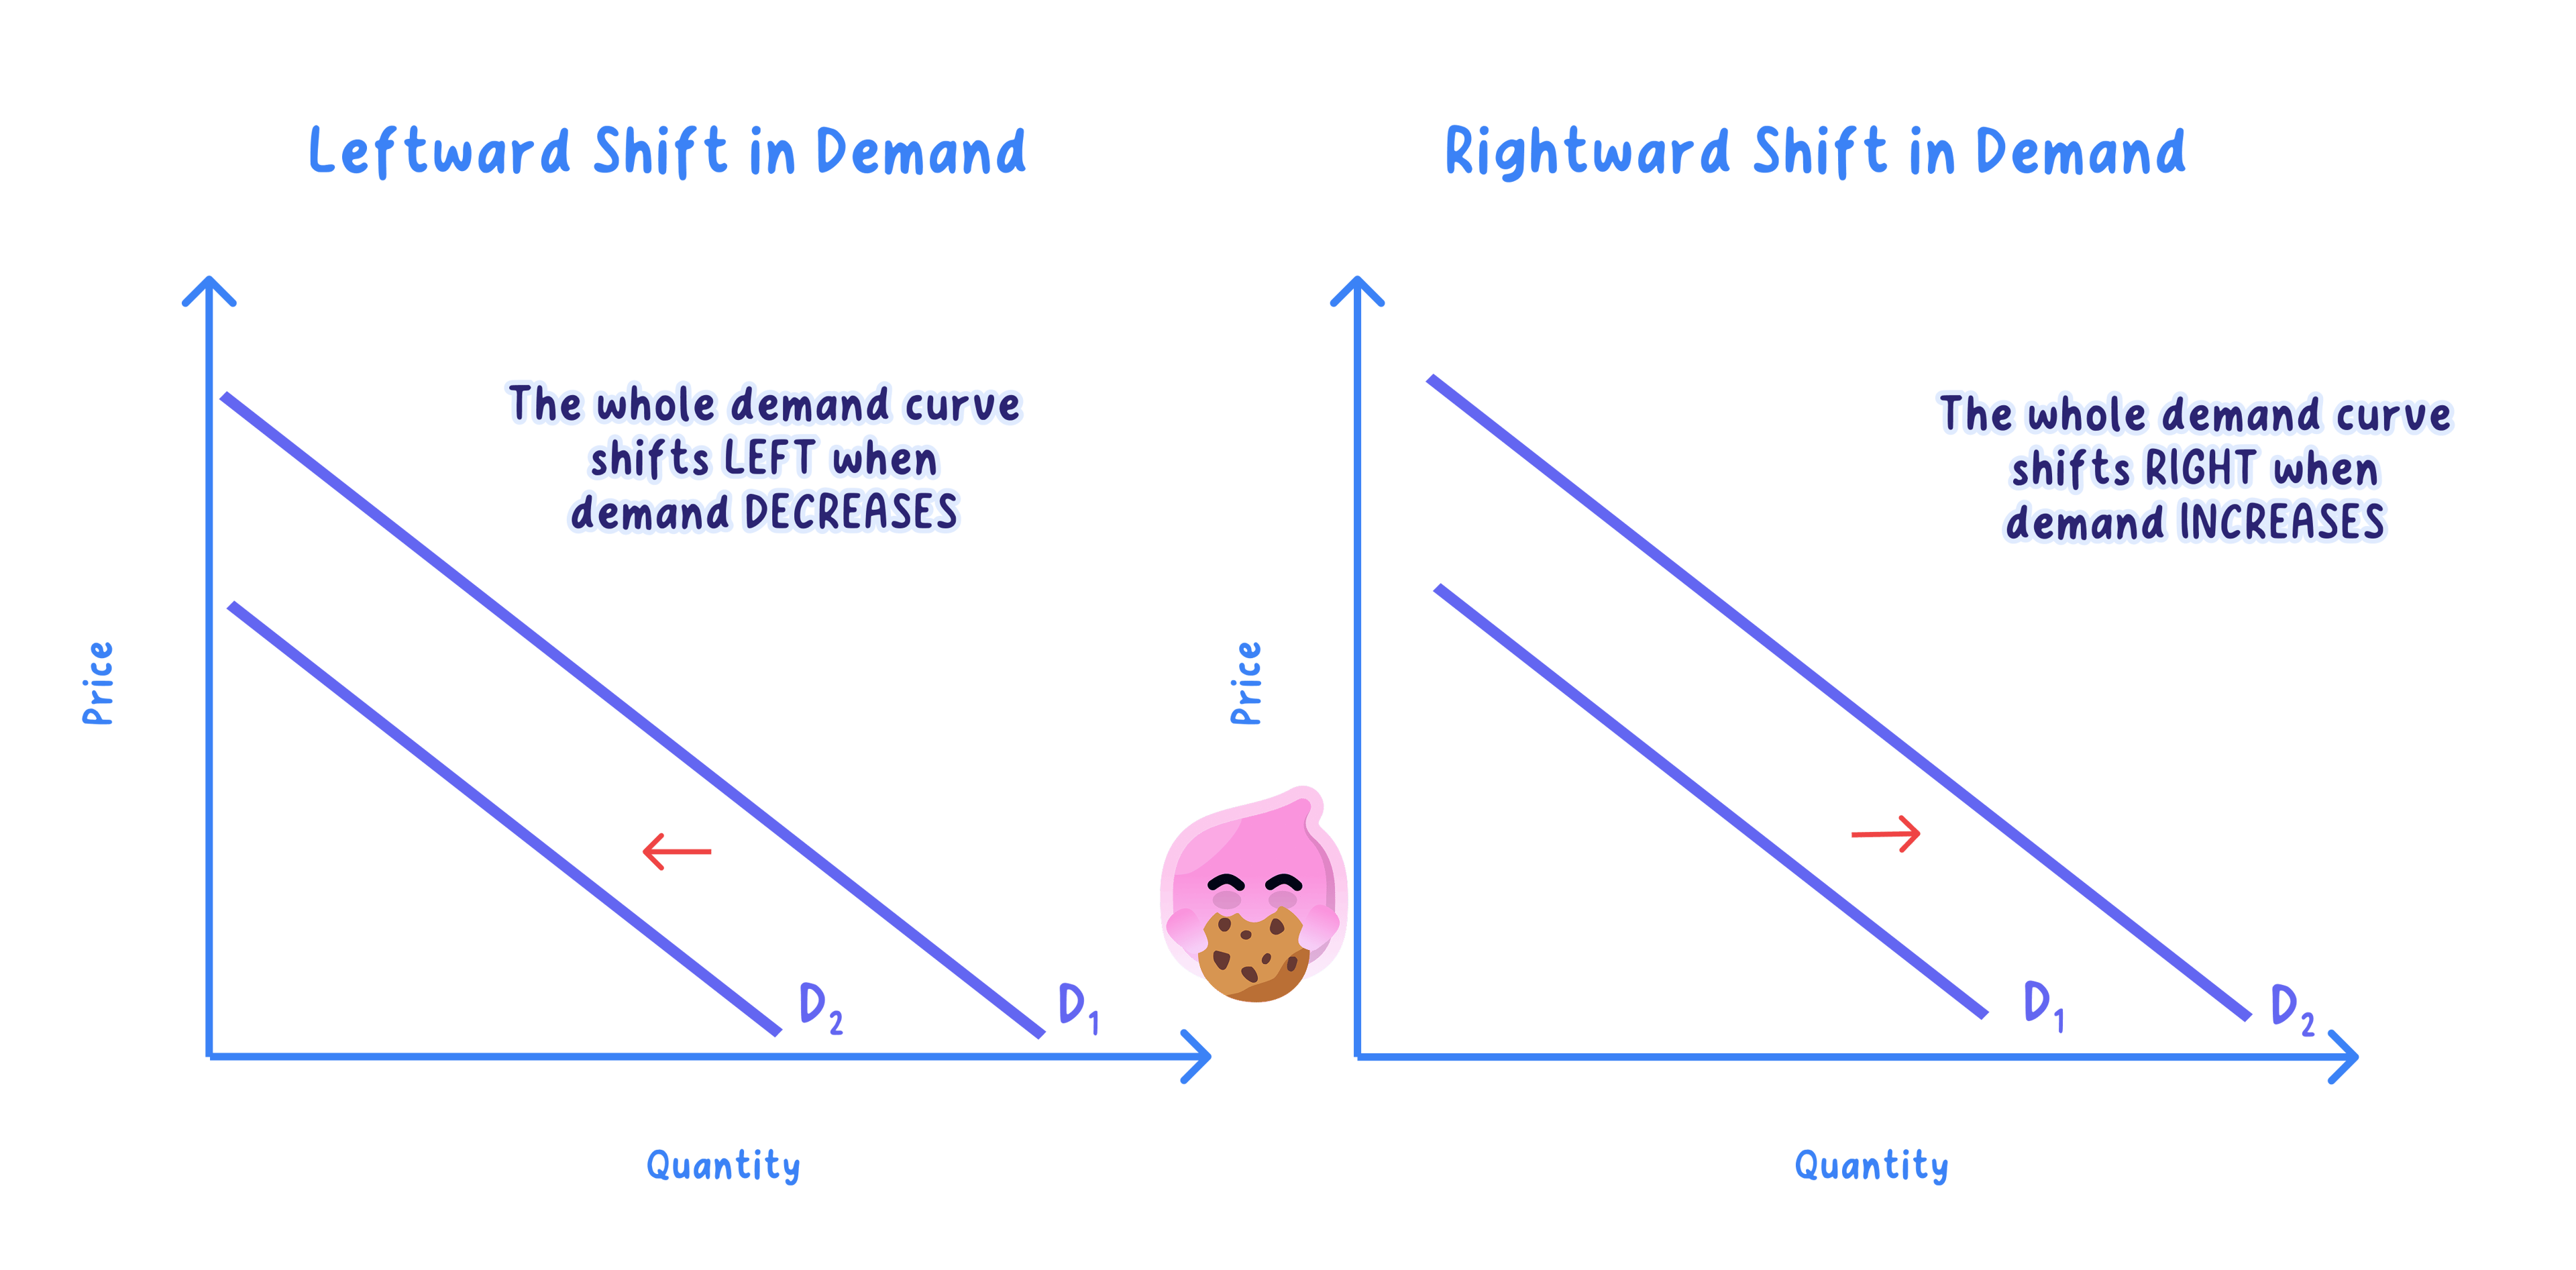
Shift in the demand curve: a change in the quantity demanded at every price, caused by a change in a condition of demand rather than the good's own price.
- At each price, buyers choose a quantity based on income, the prices of related goods, tastes and the other conditions of demand.
- If one condition changes favourably, buyers now want more of the good at that same price, drawn as a rightward (+) shift.
- An unfavourable change works in reverse, shifting the whole curve to the left (−).
- The good's own price is held constant throughout, so a condition change is a shift and never a movement along.
- At the original price the shift creates a shortage or surplus, which then pushes the market to a new equilibrium.
Key Idea
- A change in any condition of demand shifts the whole curve; a change in the good's own price only moves along it.
- A rightward shift means more is demanded at every price; a leftward shift means less.
Definition
Normal good: a good whose demand rises when real income rises, such as restaurant meals.
Inferior good: a good whose demand falls when real income rises, such as own-brand instant noodles.
Substitute: a good bought instead of another, such as coffee for tea.
Complement: a good bought alongside another, such as milk with tea.
Causes of the shift
- Real income: for a normal good like restaurant meals a pay rise shifts demand right, whereas for an inferior good like own-brand noodles higher income shifts demand left as buyers trade up.
- Prices of related goods: if the price of coffee (a substitute) rises from £3 to £5 a cup, demand for tea shifts right; if the price of milk (a complement) rises, demand for tea shifts left.
- Tastes and preferences: a viral fitness trend lifts demand for gym memberships and shifts it right, whereas a health scare over sugary drinks shifts their demand left.
- Population: a rising number of pensioners shifts demand for retirement housing right, as more buyers enter that part of the market.
- Expectations: if buyers expect house prices to rise next year, some bring purchases forward, shifting current demand right.
Example
- The price of coffee, a substitute for tea, rises sharply from £3 to £5 a cup.
- Coffee is now relatively dearer, so at each price of tea more buyers switch to tea.
- The demand curve for tea shifts right, because more tea is demanded at every tea price.
- At the original price of tea there is now a shortage, as quantity demanded exceeds quantity supplied.
- The shortage bids the price of tea up, so equilibrium price and quantity of tea both tend to rise.
Direction and size
- A rightward shift tends to raise both equilibrium price and quantity, while a leftward shift tends to lower both, ceteris paribus.
- Getting the direction wrong reverses the whole prediction, so identify it before drawing.
- How far price rather than quantity moves depends on the price elasticity of supply, so the split between the two is not automatic: it depends on how easily firms can raise output.
Exam technique
- State which condition changed and whether it shifts demand left or right.
- Never explain a shift by a change in the good's own price.
- Follow the shift through to the new equilibrium price and quantity.
Common Mistake
- Do not explain a shift by the good's own price; that is a movement along the curve, not a shift.
- Do not assume every good's demand rises when income rises; demand for an inferior good falls.
Self review
- What kind of change causes the demand curve to shift?
- Which way does a favourable change shift demand?
- Name four causes of a shift in demand.
- How does a rightward shift affect equilibrium price and quantity?
- How does higher income affect demand for an inferior good?
