Budget line shifts
Definition
Budget line: a line showing every combination of two goods a consumer can just afford, given a fixed money income and the two prices.
Real income: the quantity of goods and services that money income can buy, which depends on money income relative to prices.
- The budget line moves whenever money income or the price of a good changes.
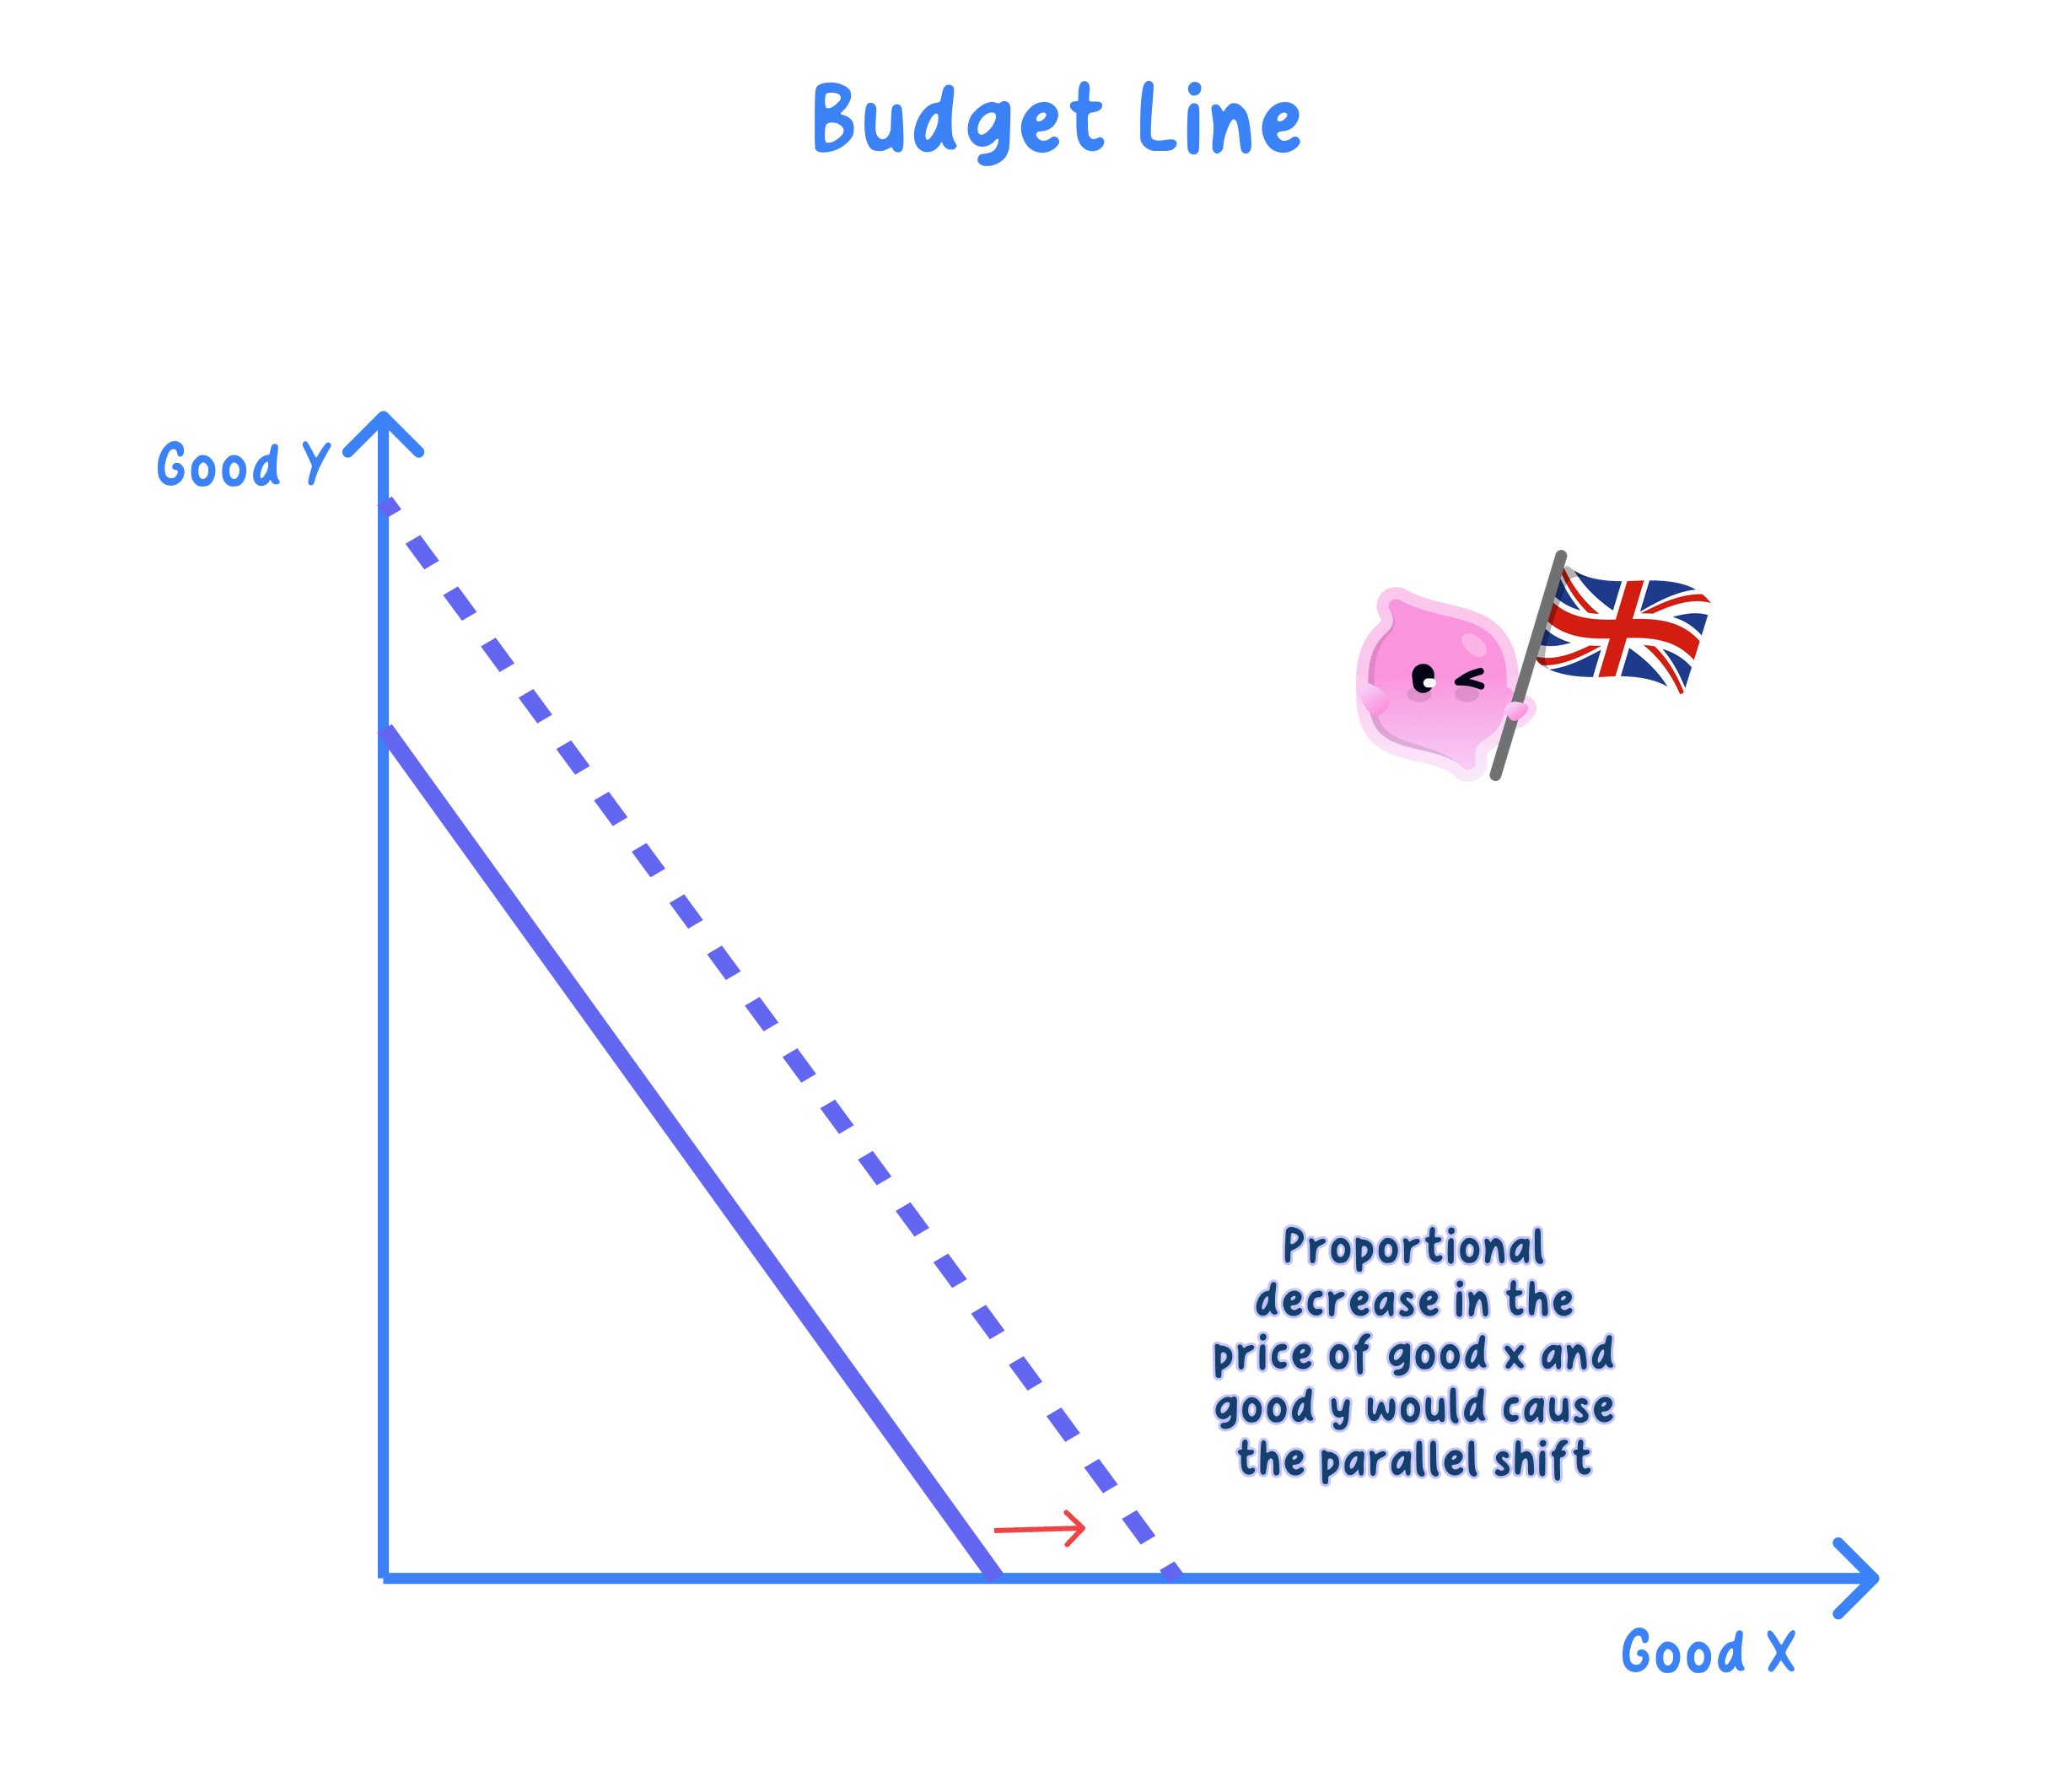
- A change in money income shifts it parallel, outwards if income rises and inwards if it falls.
- A change in one price pivots the line around the intercept of the other good.
Key Idea
- A change in income shifts the budget line parallel.
- A change in one price pivots the budget line and changes its slope.
- Each change alters the affordable set and so moves the optimum.
Change in income
- More income lets the consumer afford more of both goods, moving the line outwards.
- Less income buys fewer of both goods, moving the line inwards.
- The slope is unchanged because relative prices are unchanged.
- Both intercepts move by the same proportion, so the shift is parallel.
Example
- Income rises from £20 to £30 (+50%) while X stays at £2 and Y stays at £1.
- The X-intercept rises from 10 to 15 and the Y-intercept from 20 to 30.
- Both intercepts rise by 50%, so the line shifts outwards parallel to the old one and the slope stays at 2.
Change in one price
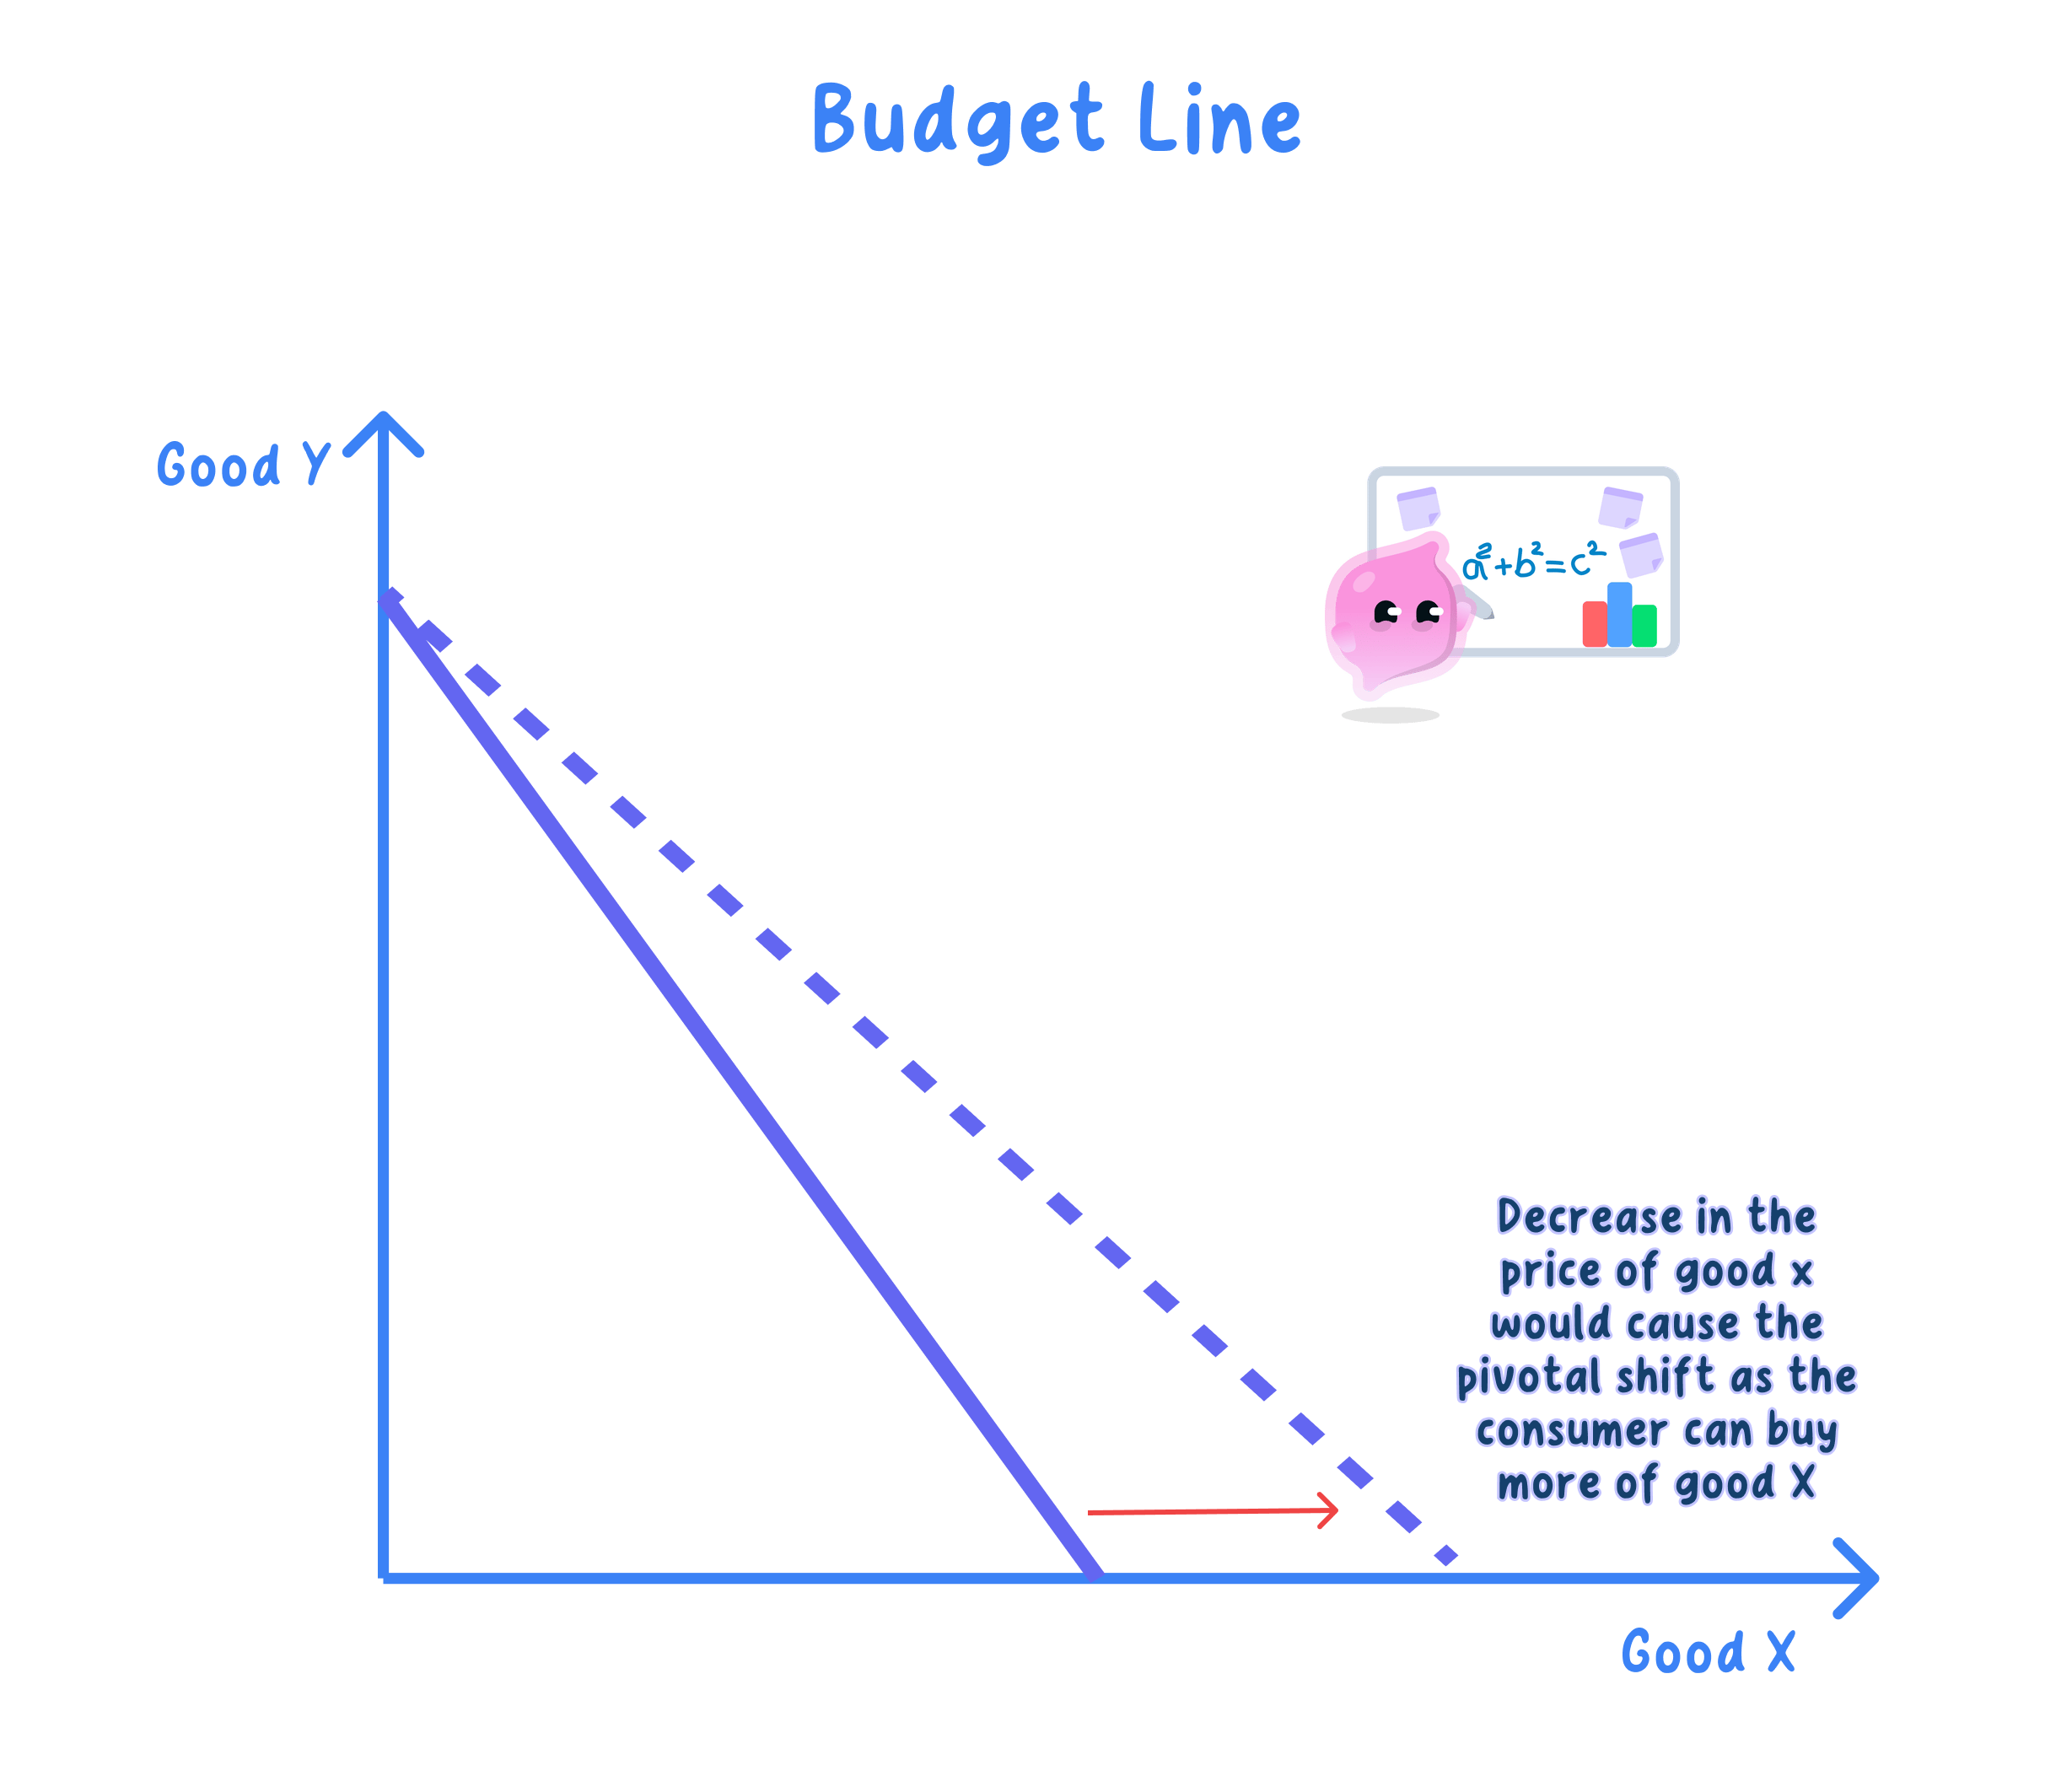
- If one good becomes cheaper, more of it can be bought, so the line pivots outwards along that good's axis.
- It pivots around the intercept of the other good, whose affordable maximum is unchanged.
- If the good becomes dearer, the line pivots inwards.
- The slope changes because the price ratio has changed.
Budget-line slope:
slope=PXPY \text{slope} = \dfrac{P_X}{P_Y} slope=PYPXExample
- Income stays at £20 and Y stays at £1, but X falls from £2 to £1 (−50%).
- The X-intercept rises from 10 to 20 while the Y-intercept stays at 20.
- Only one intercept moves, so the line pivots and its slope falls from 2 to 1, making X relatively cheaper.
Effect on the optimum
- Any shift or pivot changes the affordable set.
- So the point of tangency with the highest reachable indifference curve moves.
- The consumer settles on a new optimum bundle.
- An equal proportional change in money income and in both prices leaves the line unchanged, because real income is unchanged.
- It depends on preferences whether the consumer ends with more or less of each good, and on whether the good is normal or inferior.
Note
- Only relative prices and real income fix the position of the budget line.
- Doubling money income and both prices at once leaves the affordable set exactly the same.
Exam technique
- State whether the change is to income or to a single price.
- Draw a parallel shift for an income change and a pivot for a price change.
- Show the new optimum on the diagram.
Common Mistake
- Do not treat an income change as pivoting the line.
- Do not treat a single price change as a parallel shift.
Self review
- What causes a parallel shift of the budget line?
- What causes the budget line to pivot?
- Why does the slope stay the same when income changes?
- Why does the slope change when one price changes?
- What happens to the optimum after the line moves?
