Question 3
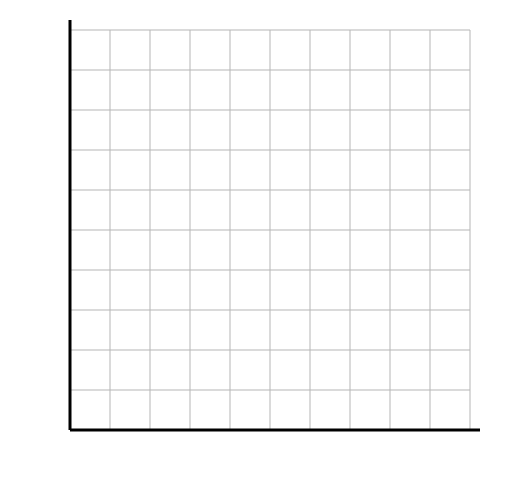
Mr Kamau asks 15 participants which activity they choose at break time, before and after a wellbeing programme. The table shows his results.
Plot a bar chart of the data. You must label the axes and include a key.
| break activity | before programme | after programme |
|---|---|---|
| Reading | 8 | 6 |
| Walking | 5 | 8 |
| Talking | 2 | 1 |
7.9 Dealing with data Questions
133 exam-style questions on CIE IGCSE Psychology 7.9 Dealing with data, covering 7.9.1 Data tables, 7.9.2 Application of data tables, 7.9.3 Measures of central tendency, 7.9.4 Application of measures of central tendency, 7.9.5 Measure of spread, 7.9.6 Application of the range, 7.9.7 Bar charts, 7.9.8 Application of bar charts, 7.9.9 Reaching a conclusion, and 7.9.10 Application of reaching conclusions. Each one has a worked solution and a mark scheme showing where the marks go.