Question 2
The table shows the number of correct responses in four sound conditions, including one condition with a score of zero.
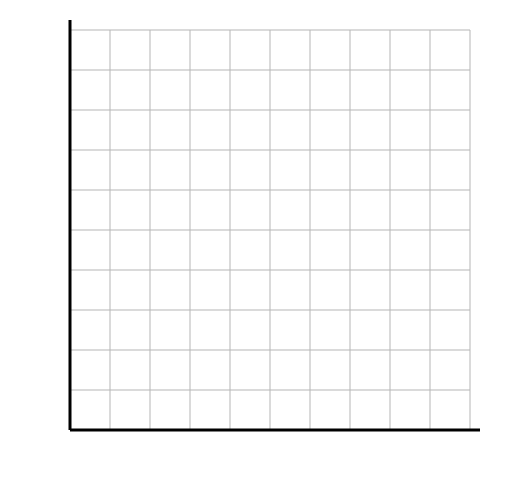
Plot a bar chart of the data. You must label the axes and include every sound condition.
| sound condition | number of correct responses |
|---|---|
| Quiet | 8 |
| Conversation | 0 |
| Music | 5 |
| Café noise | 3 |
7.9 Dealing with data Questions
133 exam-style questions on CIE IGCSE Psychology 7.9 Dealing with data, covering 7.9.1 Data tables, 7.9.2 Application of data tables, 7.9.3 Measures of central tendency, 7.9.4 Application of measures of central tendency, 7.9.5 Measure of spread, 7.9.6 Application of the range, 7.9.7 Bar charts, 7.9.8 Application of bar charts, 7.9.9 Reaching a conclusion, and 7.9.10 Application of reaching conclusions. Each one has a worked solution and a mark scheme showing where the marks go.