Geographical enquiry involving fieldwork in one Paper 1 environment
What you'll learn
- How a fieldwork enquiry works from question to conclusion.
- The difference between primary, secondary, quantitative and qualitative data.
- The fieldwork options for rivers, coasts and hazardous environments.
- How to analyse, present and evaluate your evidence in Paper 1 Section B.
Why fieldwork matters in Paper 1
In Edexcel International GCSE Geography, fieldwork means collecting geographical evidence outside the classroom. In Paper 1 Section B, you are assessed on one geographical enquiry linked to one physical geography topic:
- River environments
- Coastal environments
- Hazardous environments
You need to understand your own enquiry, but you also need to apply the same skills to unfamiliar fieldwork data from the same type of environment.
Geographical enquiry
A geographical enquiry is a structured investigation that starts with a question, collects evidence, analyses patterns, reaches conclusions and evaluates how good the evidence is.
The enquiry is easiest to remember as a cycle: question → planning → data collection → presentation and analysis → conclusion and evaluation.
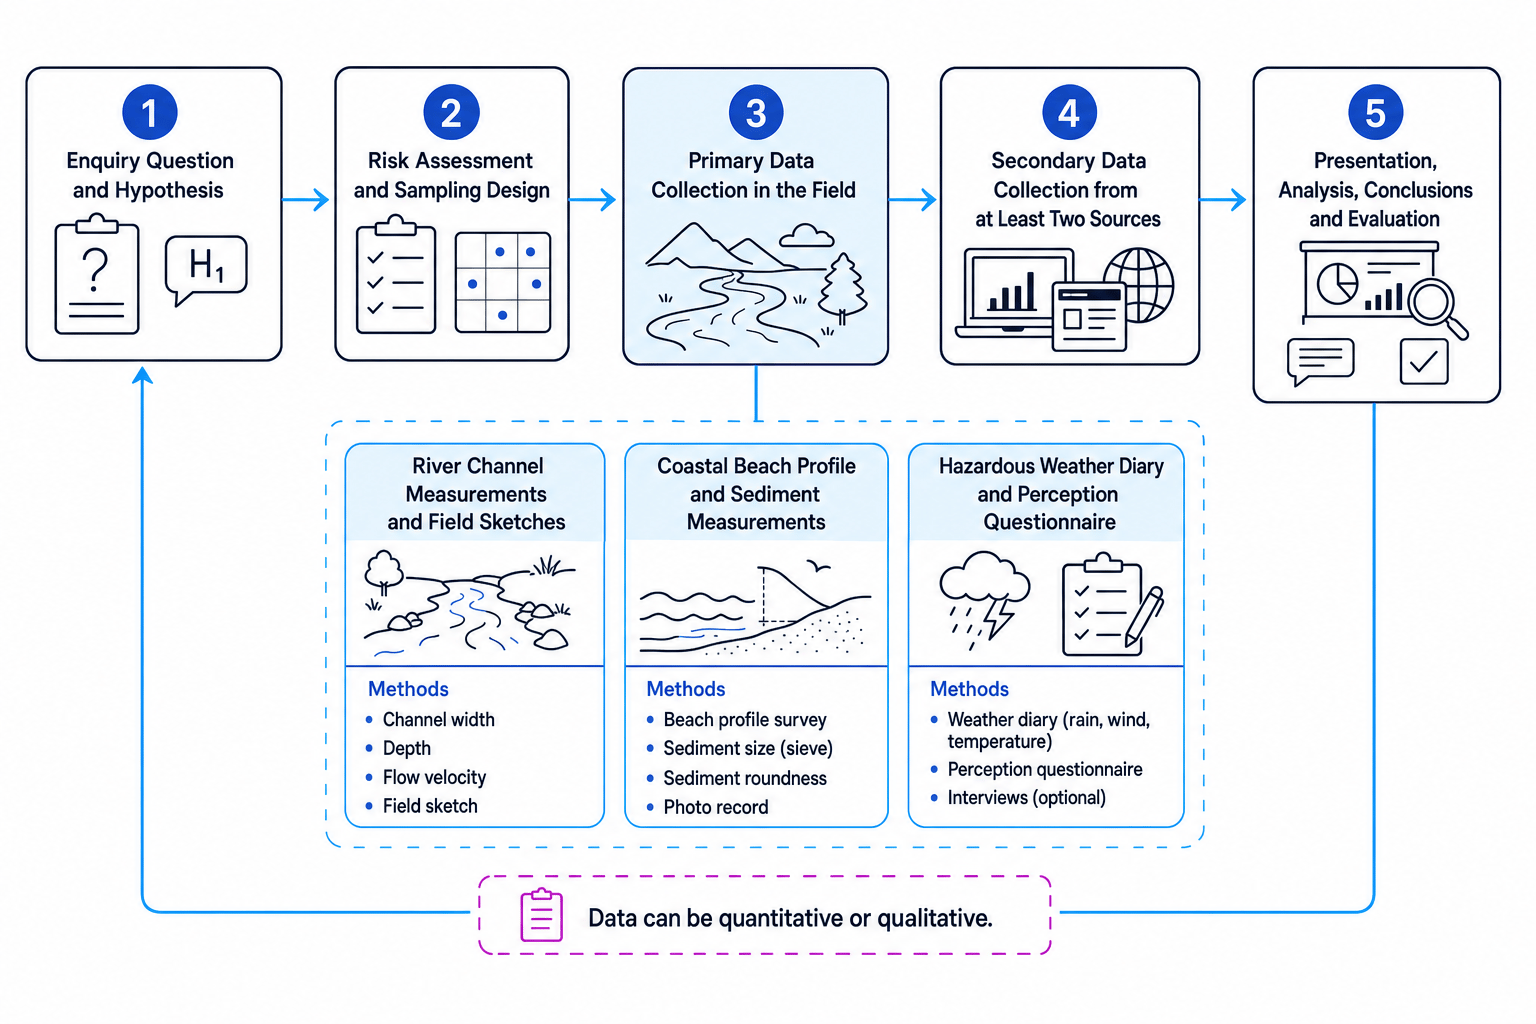
The big picture
Fieldwork is not just “what you did on the trip”. The exam tests whether you can explain why methods were chosen, what the data shows, and how far the evidence can be trusted.
The basic language of fieldwork
Core data terms
- Primary data is information you collect yourself for your enquiry, such as river depth readings or beach sediment measurements.
- Secondary data is information collected by someone else, such as a GIS map, weather station data, historic maps or newspaper reports.
- Quantitative data is numerical data, such as velocity in m/s, rainfall in mm, or sediment size in mm.
- Qualitative data is descriptive data, such as annotated field sketches, photographs or written observations.
For this Paper 1 fieldwork requirement, your centre must make sure your enquiry includes:
- primary quantitative techniques
- primary qualitative techniques
- at least two different secondary data sources
Secondary sources should genuinely add extra evidence. For example, a local geology map and historic coastline maps are two different sources; two screenshots from the same website showing the same thing are much weaker.
Selecting suitable data sources for a coastal enquiry
- Choose a focused enquiry, such as: “How does beach form vary along a stretch of coast at Hornsea, East Yorkshire?”
- Match primary quantitative data to the question: measure beach profiles at several transects and record sediment size at each site.
- Add primary qualitative evidence: take annotated photographs and draw field sketches showing groynes, wave-cut platforms or beach width.
- Choose two secondary sources that help explain the pattern: use a local geology map to identify rock type and historic maps or aerial images to show past coastal change.
Designing your enquiry
Enquiry questions and hypotheses
A good enquiry question is located, measurable and linked to geography. It should not be so broad that you cannot collect enough evidence.
Hypothesis
A hypothesis is a testable prediction. It usually suggests a relationship, such as “river velocity increases downstream” or “beach sediment becomes smaller with distance from a groyne”.
Your location also matters. You should be able to set it in a national context, such as “a small river in Surrey, south-east England” or “a defended coastline in East Yorkshire, north-east England”.
Turning a broad river topic into a testable hypothesis
- Start with a broad idea: rivers change as they move downstream.
- Choose measurable variables: distance downstream, channel width, depth, velocity and sediment size.
- Add a named location: for example, a series of sites along the River Tillingbourne in Surrey.
- Form a testable hypothesis: “Channel width and mean velocity increase downstream along the River Tillingbourne.”
Sampling
Sampling
A sample is a smaller set of measurements used to represent a wider area or process. A sampling strategy is the method used to decide where, when or who to sample.
Common sampling strategies include:
- Systematic sampling: collecting data at regular intervals, such as every 10 m along a beach.
- Random sampling: using chance to choose sites or questionnaire participants, reducing personal bias.
- Stratified sampling: dividing the study area into groups, such as upper, middle and lower river sites, then sampling each group.
Biased sampling
Do not only collect data from the easiest or safest-looking places and then pretend it represents the whole environment. Explain how your sampling choices may have affected the results.
Fieldwork contexts: choose one Paper 1 environment
You only complete one enquiry, but you should know what valid fieldwork looks like for each Paper 1 physical environment.
River environments
River fieldwork investigates river processes such as erosion, transportation and deposition, and river form, meaning the shape and features of the channel.
Primary quantitative techniques may include:
- channel width using a tape measure
- depth readings across the channel
- velocity using a flow meter or float method
- gradient using a clinometer
- sediment size and shape measurements
Primary qualitative techniques may include:
- annotated field sketches of the river channel
- photographs showing how the channel changes downstream
Secondary sources may include:
- a GIS topographic map, such as ArcGIS Online or Google Earth
- local river flow or river regime data from an official monitoring source
Calculating mean depth and discharge
- Add the depth readings across the channel and divide by the number of readings:
- Estimate cross-sectional area using channel width and mean depth:
- If mean velocity is 0.50 m/s, calculate discharge:
- Compare discharge between sites to judge whether flow increases downstream, then link the pattern to tributaries, channel size or recent rainfall.
Coastal environments
Coastal fieldwork investigates coastal processes, such as erosion, transportation and deposition, and coastal form, meaning landforms like beaches, cliffs, spits or wave-cut platforms.
Primary quantitative techniques may include:
- sediment size and shape measurements
- a beach profile survey from the backshore towards the sea
- measurements of erosional features, such as a cliff face or intertidal zone
Beach profile
A beach profile is a cross-section showing how beach height changes with distance from the land towards the sea.
Primary qualitative techniques may include:
- annotated field sketches of coastal features
- photographs showing variation along a stretch of coast
Secondary sources may include:
- a local geology map, paper or digital
- local coastal change data, such as historic maps, old aerial photographs or shoreline management information
Hazardous environments
Hazardous environment fieldwork investigates the physical processes involved in an extreme weather event, such as a storm, flood, heatwave or very heavy rainfall event.
Extreme weather event
An extreme weather event is weather that is unusual, severe or damaging for a particular place, such as Storm Eunice in the UK in February 2022.
Primary quantitative techniques may include:
- a weather diary recording rainfall, temperature, wind or cloud cover
- local risk and hazard maps
- structured questionnaires about hazard perception
Primary qualitative techniques may include:
- annotated field sketches showing evidence of damage or risk
- photographs or video taken before, during or after the event, where safe
Secondary sources may include:
- an online feed from a local weather station, such as Wunderground
- local reports from newspapers, council updates or online eyewitness accounts
Safety first
For hazardous environments, you should not put yourself at risk to collect data. Much useful evidence can be gathered before or after the event, or from safe secondary sources.
Practical skills you need to show
Presenting data clearly
Graphical skills are ways of turning raw data into visual evidence. Depending on your enquiry, you may compile:
- line graphs, bar charts or scattergraphs
- beach profiles or river cross-sections
- flow lines to show movement, such as longshore drift direction
- proportional symbols, where symbol size represents data size
- annotated maps, diagrams and photographs
A graph should help answer the enquiry question, not just look neat.
Choosing a graph
Use a scattergraph when you are testing a relationship, such as distance downstream against velocity. Use a line graph when the order of points matters, such as a beach profile from land to sea.
Maps, photographs and sketches
Map skills include using grid references, scales and symbols, and identifying landforms and human features. Digital maps are especially useful for measuring distance, checking relief and locating fieldwork sites.
GIS
A Geographical Information System or GIS is digital mapping software that stores, displays and analyses spatial data, such as layers for relief, land use, geology or flood risk.
Photo-interpretation means reading evidence from images. A vertical aerial photograph is taken from directly above, while an oblique aerial photograph is taken at an angle. Satellite images and GIS layers can help you spot landforms, land use and change over time.
Sketching skills involve simple sketch maps and field sketches. A good field sketch is selective: it labels the features that matter to the enquiry and adds short explanatory annotations.
Cognitive enquiry skills: from data to judgement
Analysis and statistics
Analysis means looking for patterns, relationships, anomalies and explanations in the data. You may use simple descriptive statistics, such as:
- mean: the total divided by the number of values
- median: the middle value when data is ordered
- mode: the most common value
- line of best fit: a line drawn through a scattergraph to show the overall trend
Interpreting downstream river data
- Compare the numerical pattern: if mean velocity rises from the upper site to the lower site, this supports the hypothesis that velocity increases downstream.
- Link the pattern to process: a wider, deeper channel usually has less friction relative to the amount of water, so flow may become more efficient.
- Use qualitative evidence as support: photographs might show the lower course has a smoother channel and fewer exposed boulders.
- Identify anomalies: if one middle site has unusually low velocity, check whether it was near a bend, obstruction, shallow riffle or measurement error.
Describing without explaining
Saying “the graph goes up” is description. A stronger answer explains why the pattern happens using process, place evidence and fieldwork method.
Stakeholders and conflict
A stakeholder is a person or group with an interest in an issue. Fieldwork can involve conflict resolution skills because different stakeholders may view the same place differently.
For example:
- coastal residents may want hard engineering to protect homes
- environmental groups may prefer natural beach processes
- tourists may value access and scenery
- local councils may focus on cost and long-term risk
You do not need to “solve” every conflict. You need to recognise different views and explain why attitudes may differ.
Evaluation
Evaluation means judging how good your enquiry was. Focus on the quality of the evidence, not just what went wrong.
Useful evaluation terms include:
- accuracy: how close a measurement is to the true value
- reliability: whether repeated measurements give similar results
- validity: whether the method actually tests the enquiry question
- representativeness: whether your sample reflects the wider area or process
Evaluating river velocity data
- Judge accuracy: a float method may overestimate surface velocity because surface water often moves faster than water near the bed.
- Judge reliability: repeating the float test three times at each site makes the average more dependable than using one reading.
- Check representativeness: if all sites were close to bridges or footpaths, they may not represent the whole river.
- Suggest realistic improvements: use a flow meter, increase the number of sites, repeat measurements after similar rainfall conditions, and compare with local river flow data.
Familiar and unfamiliar contexts in the exam
In a familiar context, questions refer to your own fieldwork. You may need to interpret, analyse, evaluate, make judgements and communicate your findings clearly.
In an unfamiliar context, the exam gives you new fieldwork data from the same type of environment you studied. For example, if you studied a river, you might be given river data from a different drainage basin. You then apply the same enquiry skills.
Use the fieldwork chain
For longer answers, follow this chain: method → data collected → result → conclusion → evaluation. It keeps your answer geographical and avoids vague storytelling.
In the exam
- Name your environment and location clearly, then link every method back to the enquiry question.
- Use evidence: quote figures from graphs, describe patterns, and refer to sketches, photos, maps or secondary sources.
- Evaluate precisely: explain accuracy, reliability, validity or sampling issues, and suggest realistic improvements.
Check yourself
- Can you explain the difference between primary, secondary, quantitative and qualitative data?
- Which two secondary sources would be suitable for your chosen Paper 1 environment?
- How would you evaluate whether your fieldwork data was reliable and representative?