Study Figures 1a, 1b, and 1c, which show information about human threats to salt marsh ecosystems in temperate coastal zones.
Figure 1a - Diagram: Impact of sea defences on salt marsh migration under sea-level rise
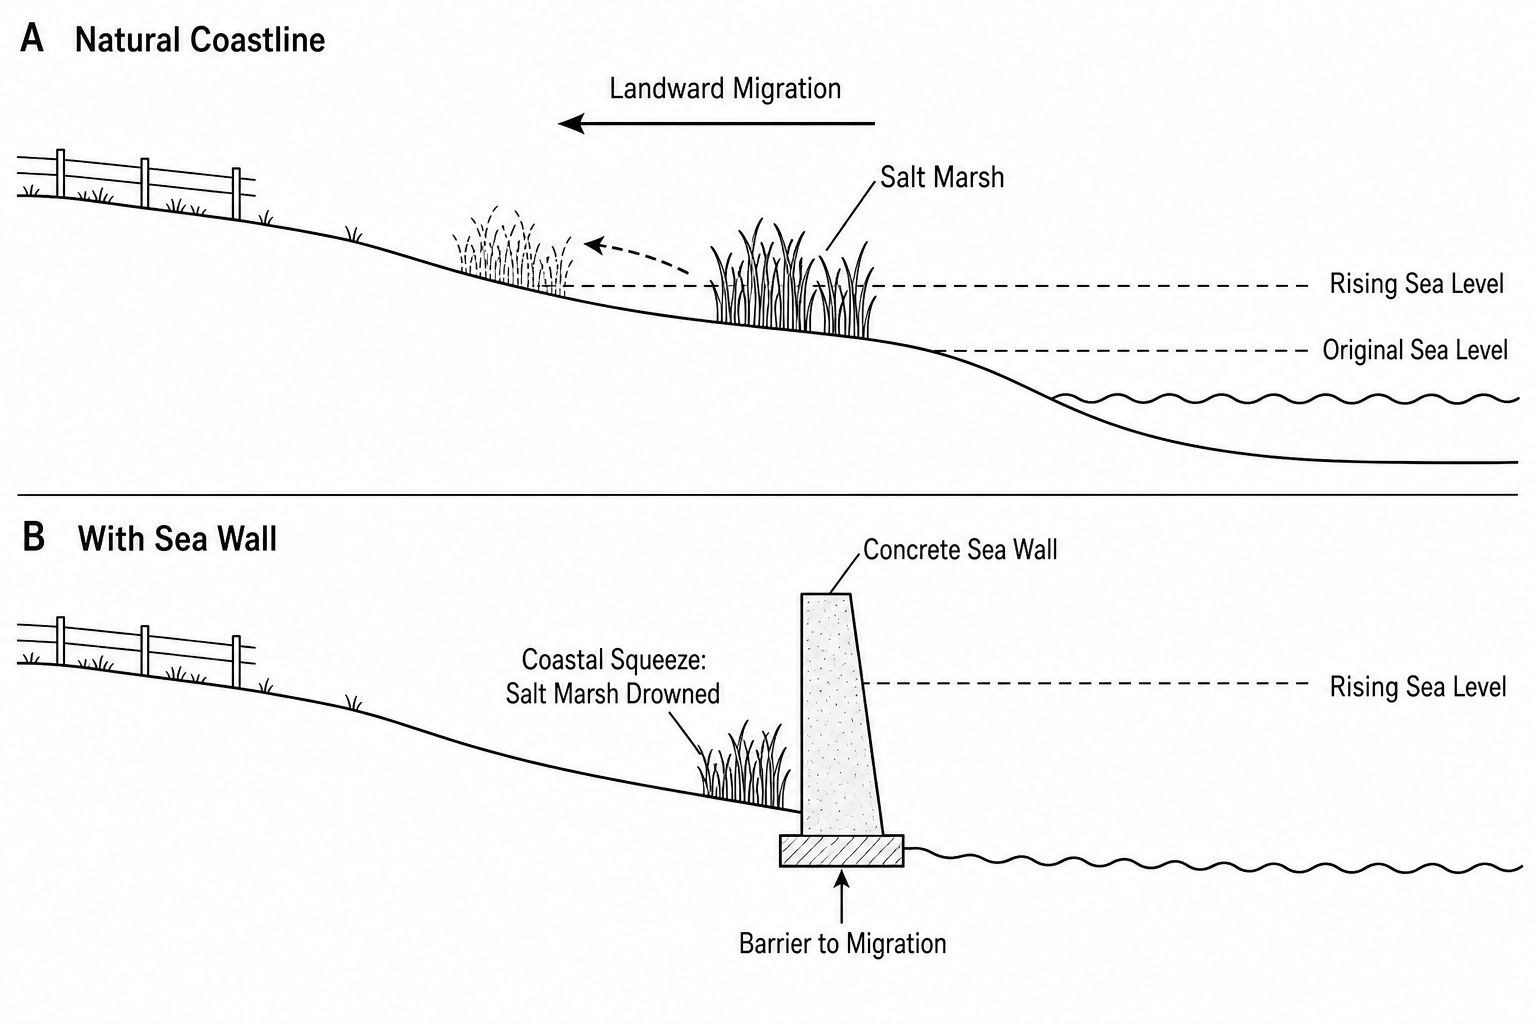
Figure 1b - Map: Spatial development plan in the Blackwater Estuary
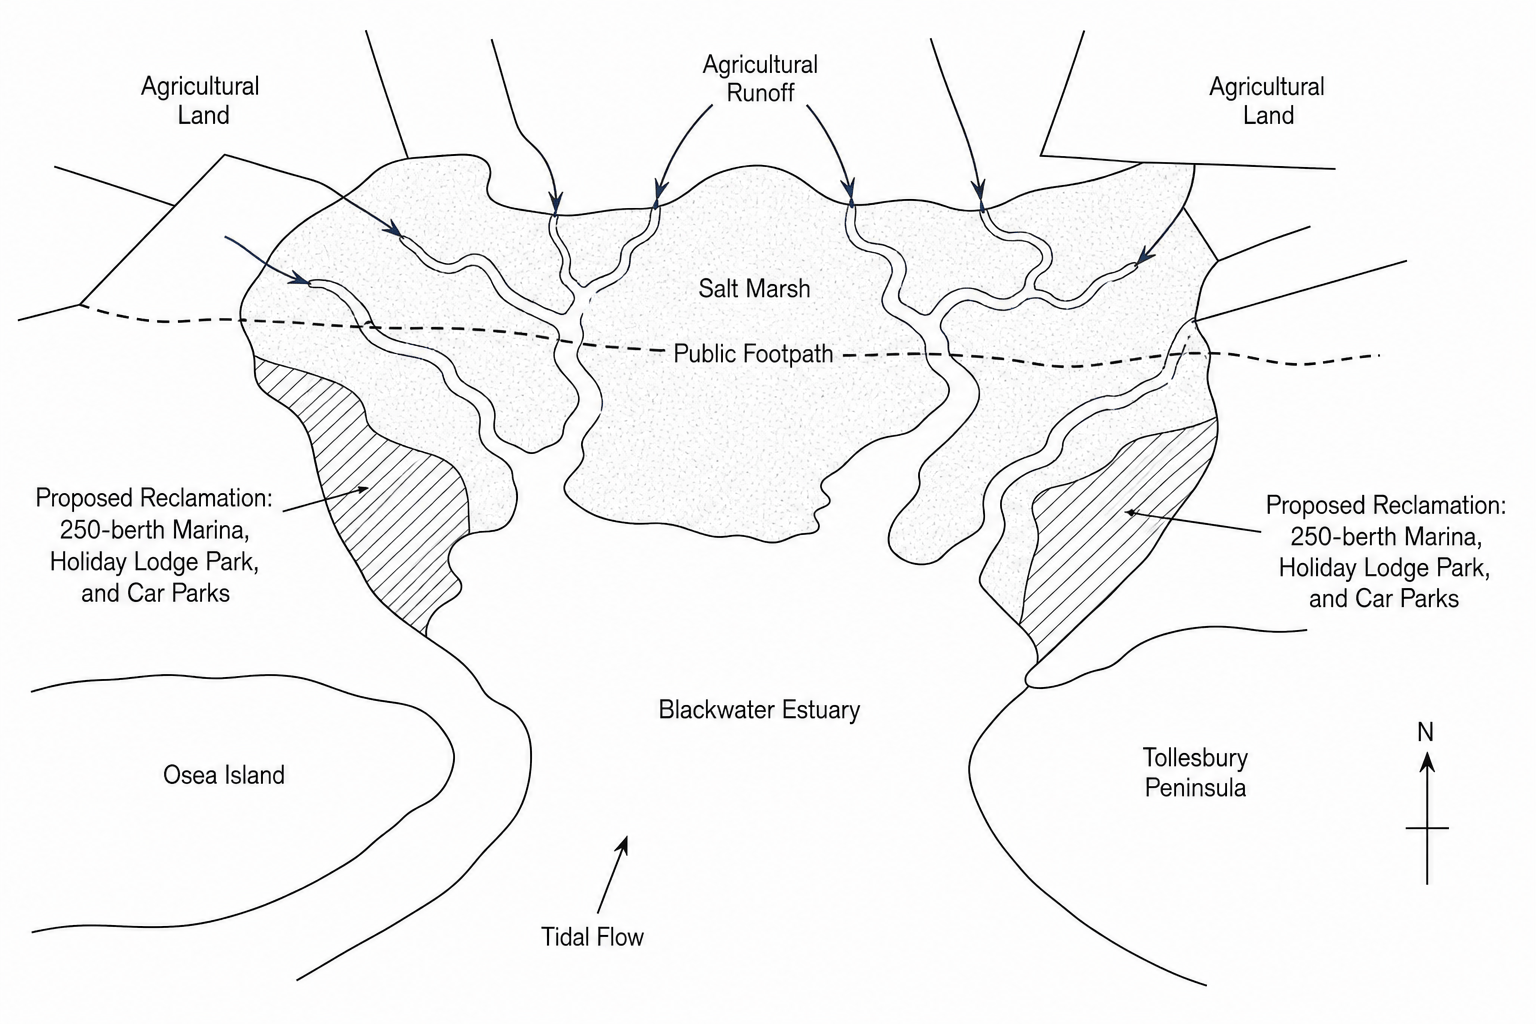
Figure 1c - Table: Coastal marshland loss and human environmental indicators (1990-2020)
| Estuary Location | Salt Marsh Loss 1990-2020 (%) | Primary Human Driver of Loss | Annual Nitrogen Runoff (tonnes/yr) |
|---|---|---|---|
| Blackwater Estuary | 18% | Coastal squeeze (sea walls) & tourism | 142 |
| Ribble Estuary | 28% | Agricultural reclamation & urban sprawl | 315 |
| Solent Estuary | 22% | Marina construction & leisure infrastructure | 198 |
Using the figures and your own geographical understanding, analyse how human activities and coastal management strategies pose threats to coastal marshland ecosystems.

