Constructing a frequency table
Definition
Frequency table
A table that records how many times each value or category appears in a set of data, often built up using tally marks.
- Frequency simply means the count: how many times a particular value or category turned up.
- Twenty pupils sit a five-word memory quiz and their scores, in the order you collected them, are 4, 3, 5, 4, 2, 4, 3, 5, 4, 3, 4, 5, 2, 4, 3, 5, 4, 4, 3 and 5.
- Work along the list one score at a time, putting a tally mark in the row for that score and grouping the marks in fives.
- A score of 2 has a frequency of 2 and a score of 3 has a frequency of 5.
- A score of 4 has a frequency of 8 and a score of 5 has a frequency of 5.
- Check your work by adding the frequencies: 2 + 5 + 8 + 5 = 20, which matches the twenty pupils.
Interpreting a frequency table and its diagram
- A score of 4 has the highest frequency at 8, so it was the most common result in the group.
- Add frequencies together to answer questions about groups of scores, so 8 + 5 = 13 pupils scored 4 or more.
- A frequency diagram draws those same counts, with the score along one axis and the frequency up the other, so the tallest bar at 4 shows the most common score at a glance.
Constructing and interpreting a bar chart
Definition
Bar chart
A chart that shows data for separate categories as bars, where the height of each bar gives the value and gaps separate the bars.
- Use a bar chart when your data falls into separate categories rather than along a number scale.
- You ask thirty pupils how they travelled to school this morning and record walk 12, bus 9, car 6 and cycle 3.
- Put the categories along the horizontal axis and the number of pupils up the vertical axis, labelling both.
- Start the vertical axis at zero, because starting above zero exaggerates the differences between the bars.
- Draw four bars of equal width at heights 12, 9, 6 and 3, leaving an even gap between each one.
- To interpret it, follow the top of a bar across to the vertical axis, so the walking bar reads 12 pupils and the cycling bar reads 3.
Constructing and interpreting a histogram
Definition
Histogram
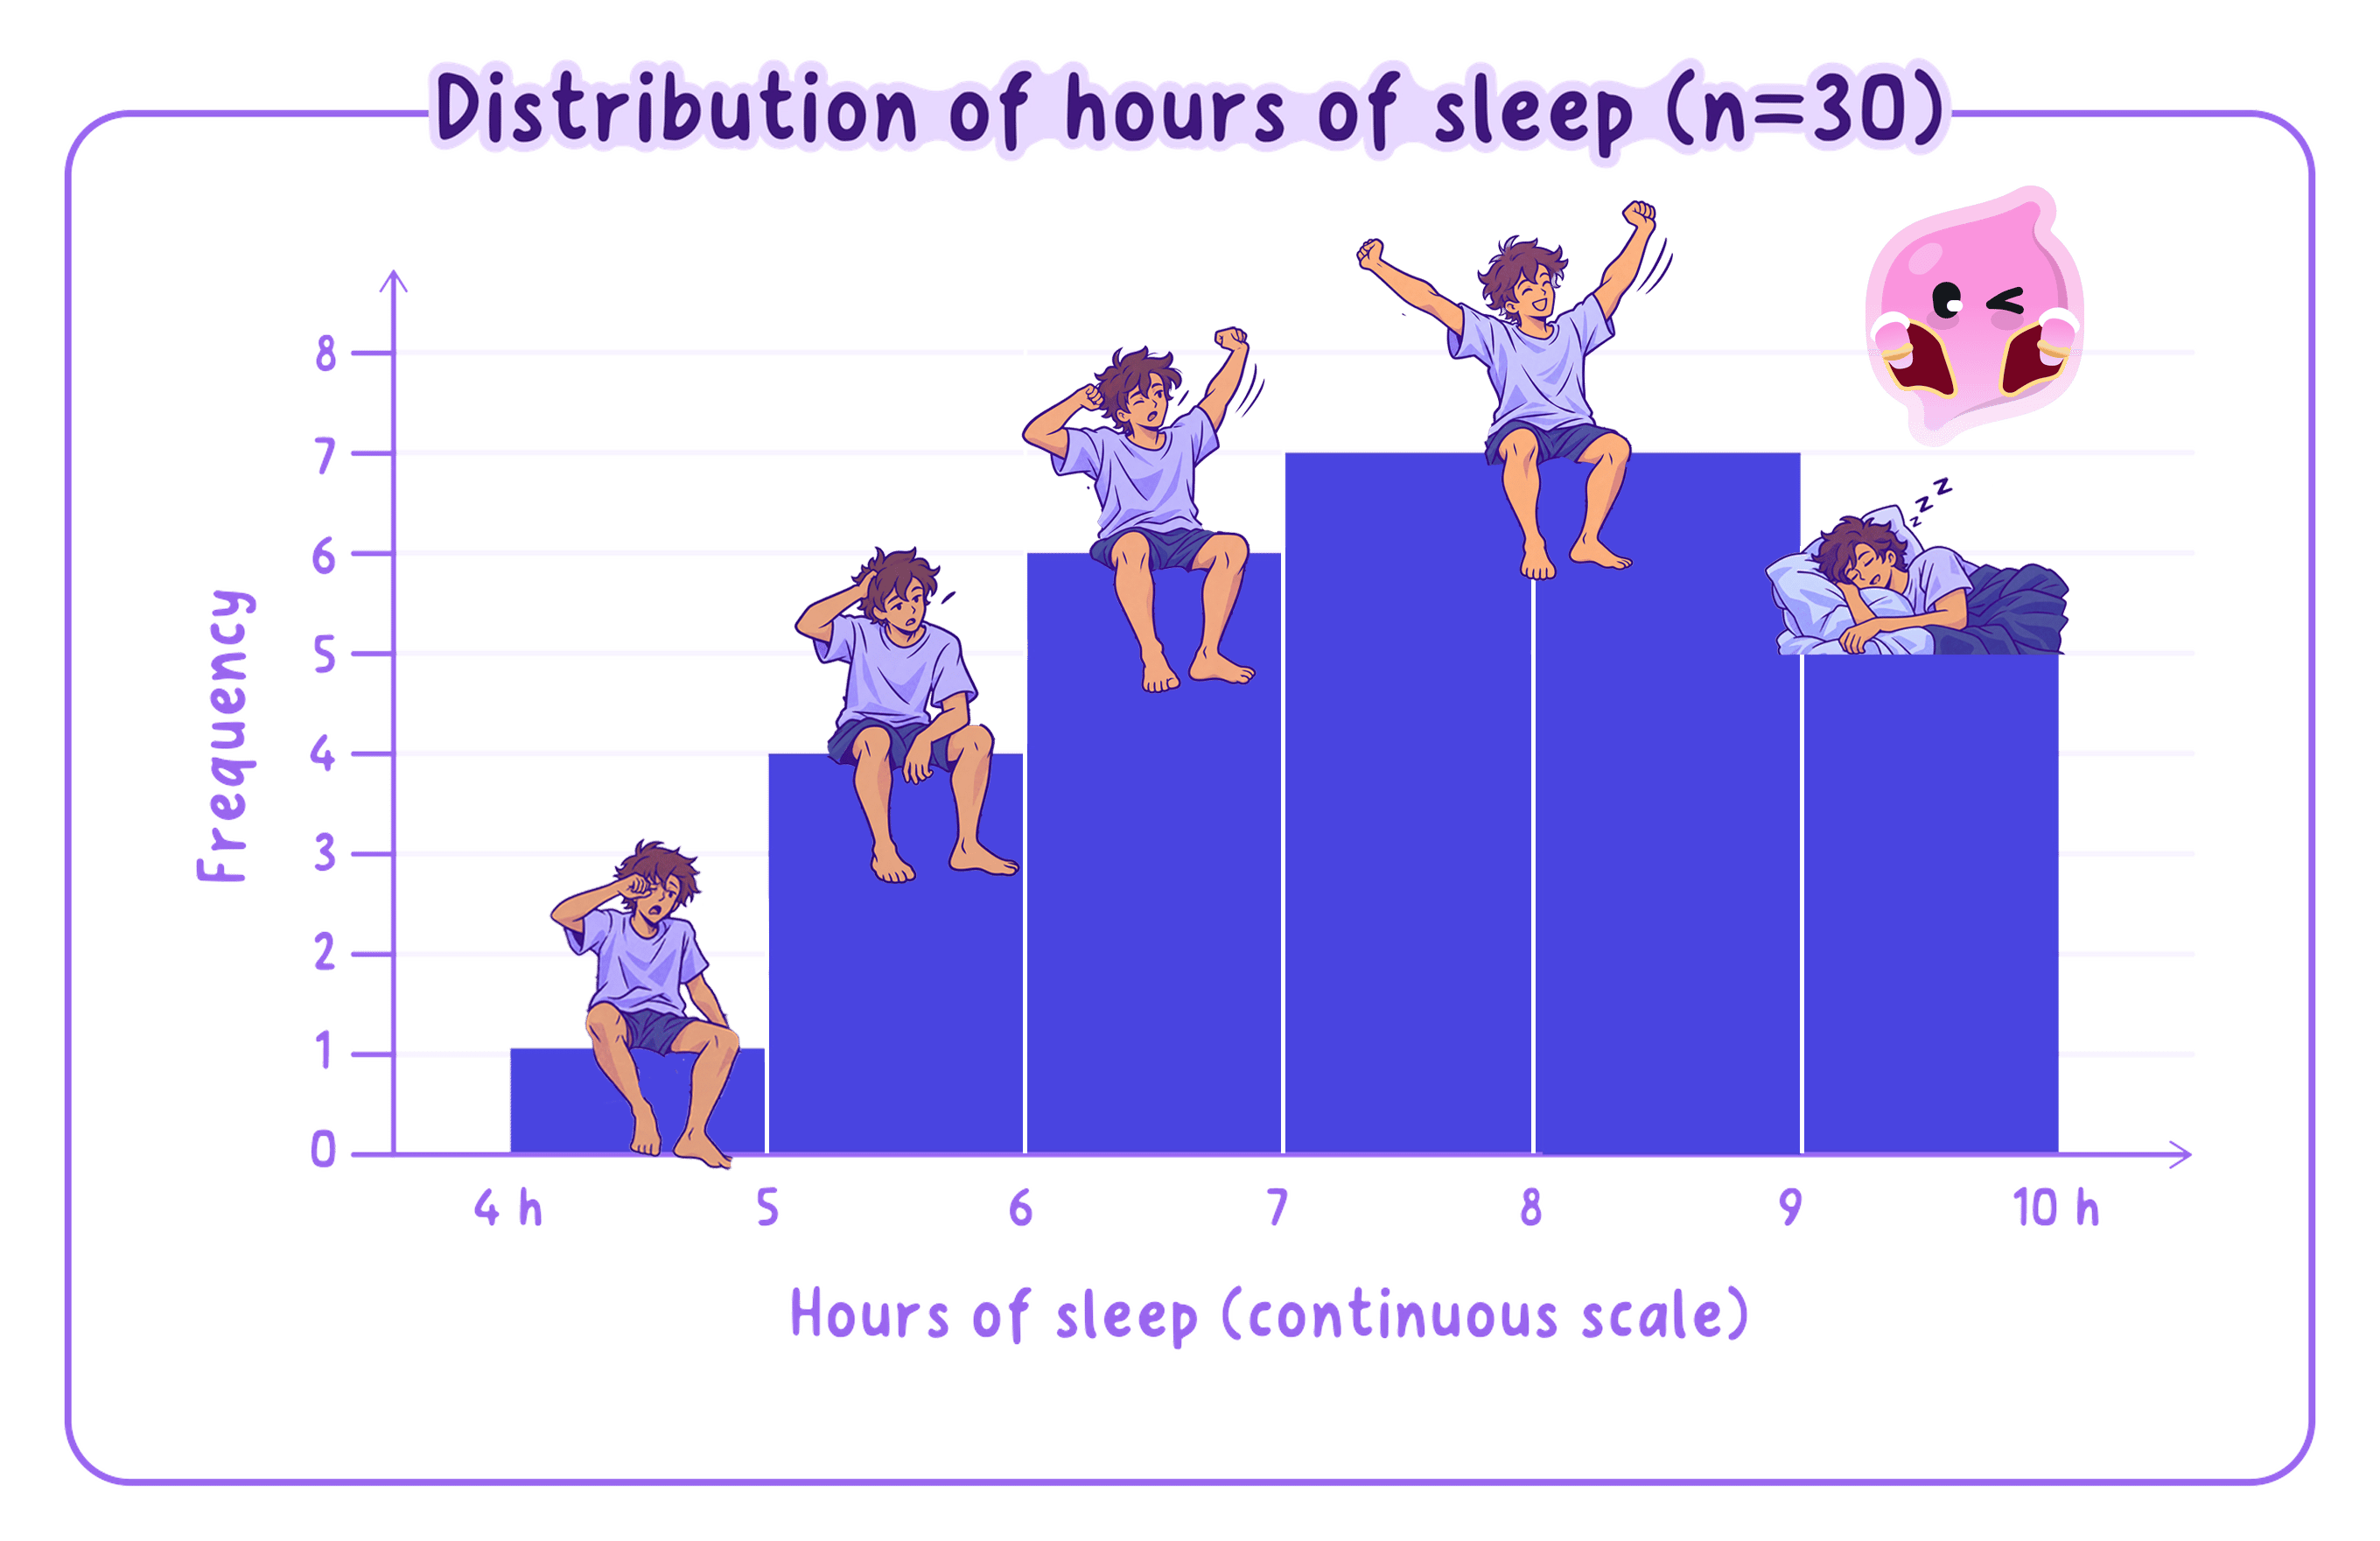
A chart that shows continuous data grouped into intervals, drawn with bars that touch because the intervals join up.
- Use a histogram when the data is continuous, meaning it can take any value in a range, such as time, height or reaction speed.
- Thirty pupils take a reaction-time test and you group their times into equal intervals of 0.1 seconds.
- 0.2 to 0.3 seconds has a frequency of 4 and 0.3 to 0.4 seconds has a frequency of 11.
- 0.4 to 0.5 seconds has a frequency of 9 and 0.5 to 0.6 seconds has a frequency of 6.
- Keep every interval the same width, because equal intervals let you read frequency straight off the height of each bar.
- Put the continuous time scale along the horizontal axis and frequency up the vertical axis, then draw the four bars at heights 4, 11, 9 and 6 so that each one touches the next.
- To interpret it, compare the heights: the 0.3 to 0.4 second bar is tallest at 11, so most pupils reacted in that band, and the four frequencies add to 30.
Common Mistake
- Do not reach for a histogram when your data is in categories such as favourite subject, because that needs a bar chart with gaps.
Constructing a scatter diagram
- A scatter diagram is the graph you draw when you have measured two things about each person.
- Six pupils record how many minutes they revised and the mark they then scored out of 80.
- 20 minutes and 42 marks, 30 minutes and 48 marks, then 40 minutes and 55 marks.
- 50 minutes and 58 marks, 60 minutes and 66 marks, then 70 minutes and 71 marks.
- Put one measurement on each axis, label both with their units, and choose scales that cover the full spread of your values.
- Plot each pupil as a single point fixed by their two scores, so the fourth pupil sits at 50 minutes across and 58 marks up.
Using a scatter diagram to identify a correlation
- Points that rise from left to right show a positive correlation, meaning that as one measurement goes up so does the other.
- Points that fall from left to right show a negative correlation, meaning that as one goes up the other goes down.
- Points scattered with no clear slope show no correlation, meaning there is no relationship to report.
- The revision points climb steadily from 42 marks at 20 minutes to 71 marks at 70 minutes, so this is a positive correlation between revision time and test score.
Common Mistake
- Do not join the points into a line, because a scatter diagram is not a line graph.
- Do not turn a correlation into a cause, because pupils who revise longer may also be the ones who slept better or found the topic easier.
Translating between graphical and numerical forms
- Going from numbers to a graph means choosing the right chart for the type of data, then plotting the values accurately.
- Going from a graph back to numbers means checking what each gridline is worth, then tracing from the point or bar down and across to each axis.
- On the reaction-time histogram, tracing the tallest bar across gives 11, and turning that back into words gives 11 of the 30 pupils, which is just over a third.
Example
Turn the travel-to-school bar chart back into numbers.
- Read the four bars across to the axis to recover 12, 9, 6 and 3 pupils.
- Add them: 12 + 9 + 6 + 3 = 30, which confirms you have read every bar correctly.
- Turn the walking bar into a percentage: 12 divided by 30 = 0.4, and 0.4 x 100 = 40% of the group.
Plotting two variables and interpreting the graph
- When one of your two variables is time, plot time along the horizontal axis and the thing you measured up the vertical axis.
- You count the canteen queue every ten minutes across the lunch hour and record the numbers waiting.
- 12:00 gives 8 pupils and 12:10 gives 22 pupils.
- 12:20 gives 31 pupils and 12:30 gives 24 pupils.
- 12:40 gives 11 pupils and 12:50 gives 4 pupils.
- The queue climbs steeply to a peak of 31 pupils at 12:20 and then falls away to just 4 by 12:50.
- Finish an interpretation by linking that shape back to what you were measuring, so here the busiest moment is twenty minutes after the bell.
Turning this into marks
- Label both axes, choose a sensible scale and plot the bars or points accurately, since each of those carries its own mark.
- Reading a scatter diagram, name the direction of the correlation and say what it means for the two things measured.
- The mark most often lost comes from misjudging what each gridline is worth before reading a value off.
Self review
- Tally these scores into a frequency table: 5, 6, 6, 7, 7, 7, 8.
- Would you use a bar chart or a histogram for the time pupils take to fall asleep, and why?
- Describe the pattern of points you would expect on a scatter diagram showing a negative correlation.
- Using the travel-to-school figures, what percentage of the thirty pupils came by bus?
