The data set you will work from
- A tutor group of ten pupils sits a spelling test marked out of 20.
- Their scores, already placed in order of size, are 11, 13, 13, 14, 15, 15, 15, 16, 18 and 20.
Finding the mean
Definition
Mean
The arithmetic average of a set of values, found by adding them all up and dividing by how many there are.
- Total = 11 + 13 + 13 + 14 + 15 + 15 + 15 + 16 + 18 + 20.
- Total = 150.
- Mean = 150 divided by 10 = 15 marks.
Finding the median
- Put the scores in order of size, then take the value sitting in the middle.
- There are 10 scores, an even number, so there is no single middle value.
- The two middle scores are the 5th and the 6th, which are 15 and 15.
- Median = (15 + 15) divided by 2 = 15 marks.
- With an odd number of scores you simply take the one in the middle position, so seven scores would give you the 4th.
Finding the mode
- Count how many times each score appears and pick the one that appears most often.
- 13 appears twice and 15 appears three times, while every other score appears once.
- Mode = 15 marks.
- When the data is grouped into bands you report the modal class instead, which is simply the band with the highest frequency.
Choosing the right measure of central tendency
- Choose the mean when the scores are numerical and no value sits far away from the rest, because it is the only measure that uses all the data.
- Choose the median when one extreme score would drag the mean away from the typical pupil, because the median only cares about position, not size.
- Choose the mode when the data is in categories rather than numbers, such as favourite subject, since you cannot add categories up.
Example
Five pupils report revising for 20, 25, 30, 35 and 150 minutes on a school night.
- Mean: 20 + 25 + 30 + 35 + 150 = 260, and 260 divided by 5 = 52 minutes.
- Median: with five ordered values the middle is the 3rd, so the median is 30 minutes.
- The mean of 52 minutes is higher than four of the five pupils actually revised, because the single value of 150 has pulled it up.
- The median of 30 minutes describes the typical pupil far better, so that is the figure to report here.
Fractions, percentages and ratios from the same scores
- Six of the ten pupils scored 15 or more, and the other four scored below 15.
- A fraction shows a part out of the whole, written with the part on top and the total underneath.
- Fraction scoring 15 or more = 6/10.
- Divide top and bottom by 2 to simplify it to 3/5.
- A percentage shows the same part out of 100, so you divide the part by the total and multiply by 100.
- 6 divided by 10 = 0.6.
- 0.6 x 100 = 60%, so 60% of the group scored 15 or more.
- A ratio compares two amounts directly, written with a colon and always in the order the question gives them.
- Higher scorers to lower scorers = 6:4.
- Divide both sides by 2 to simplify it to 3:2.
Example
The same tutor group had averaged 12 marks on the previous week's test, and this week they averaged 15.
- Change in the mean = 15 minus 12 = 3 marks.
- Divide the change by the starting figure: 3 divided by 12 = 0.25.
- 0.25 x 100 = 25%, so the mean score rose by 25%.
- Always divide by the starting figure, never by the finishing one, or the percentage change comes out wrong.
Finding the range as a measure of dispersion
Definition
Range
A measure of spread found by subtracting the lowest value from the highest value in a dataset. It shows how varied the data are.
- Dispersion means spread, so the range answers a different question from an average: not what is typical, but how varied the scores are.
- Highest = 20 and lowest = 11.
- Range = 20 - 11 = 9 marks.
- Its weakness is that it uses only two values, so a single unusual score stretches it and hides how tightly the rest cluster.
- In the revision example the range is 150 - 20 = 130 minutes, even though four of the five pupils sat within 15 minutes of each other.
Common Mistake
- Do not report the range on its own, because spread only means something next to a typical value.
The characteristics of a normal distribution
Definition
Normal distribution
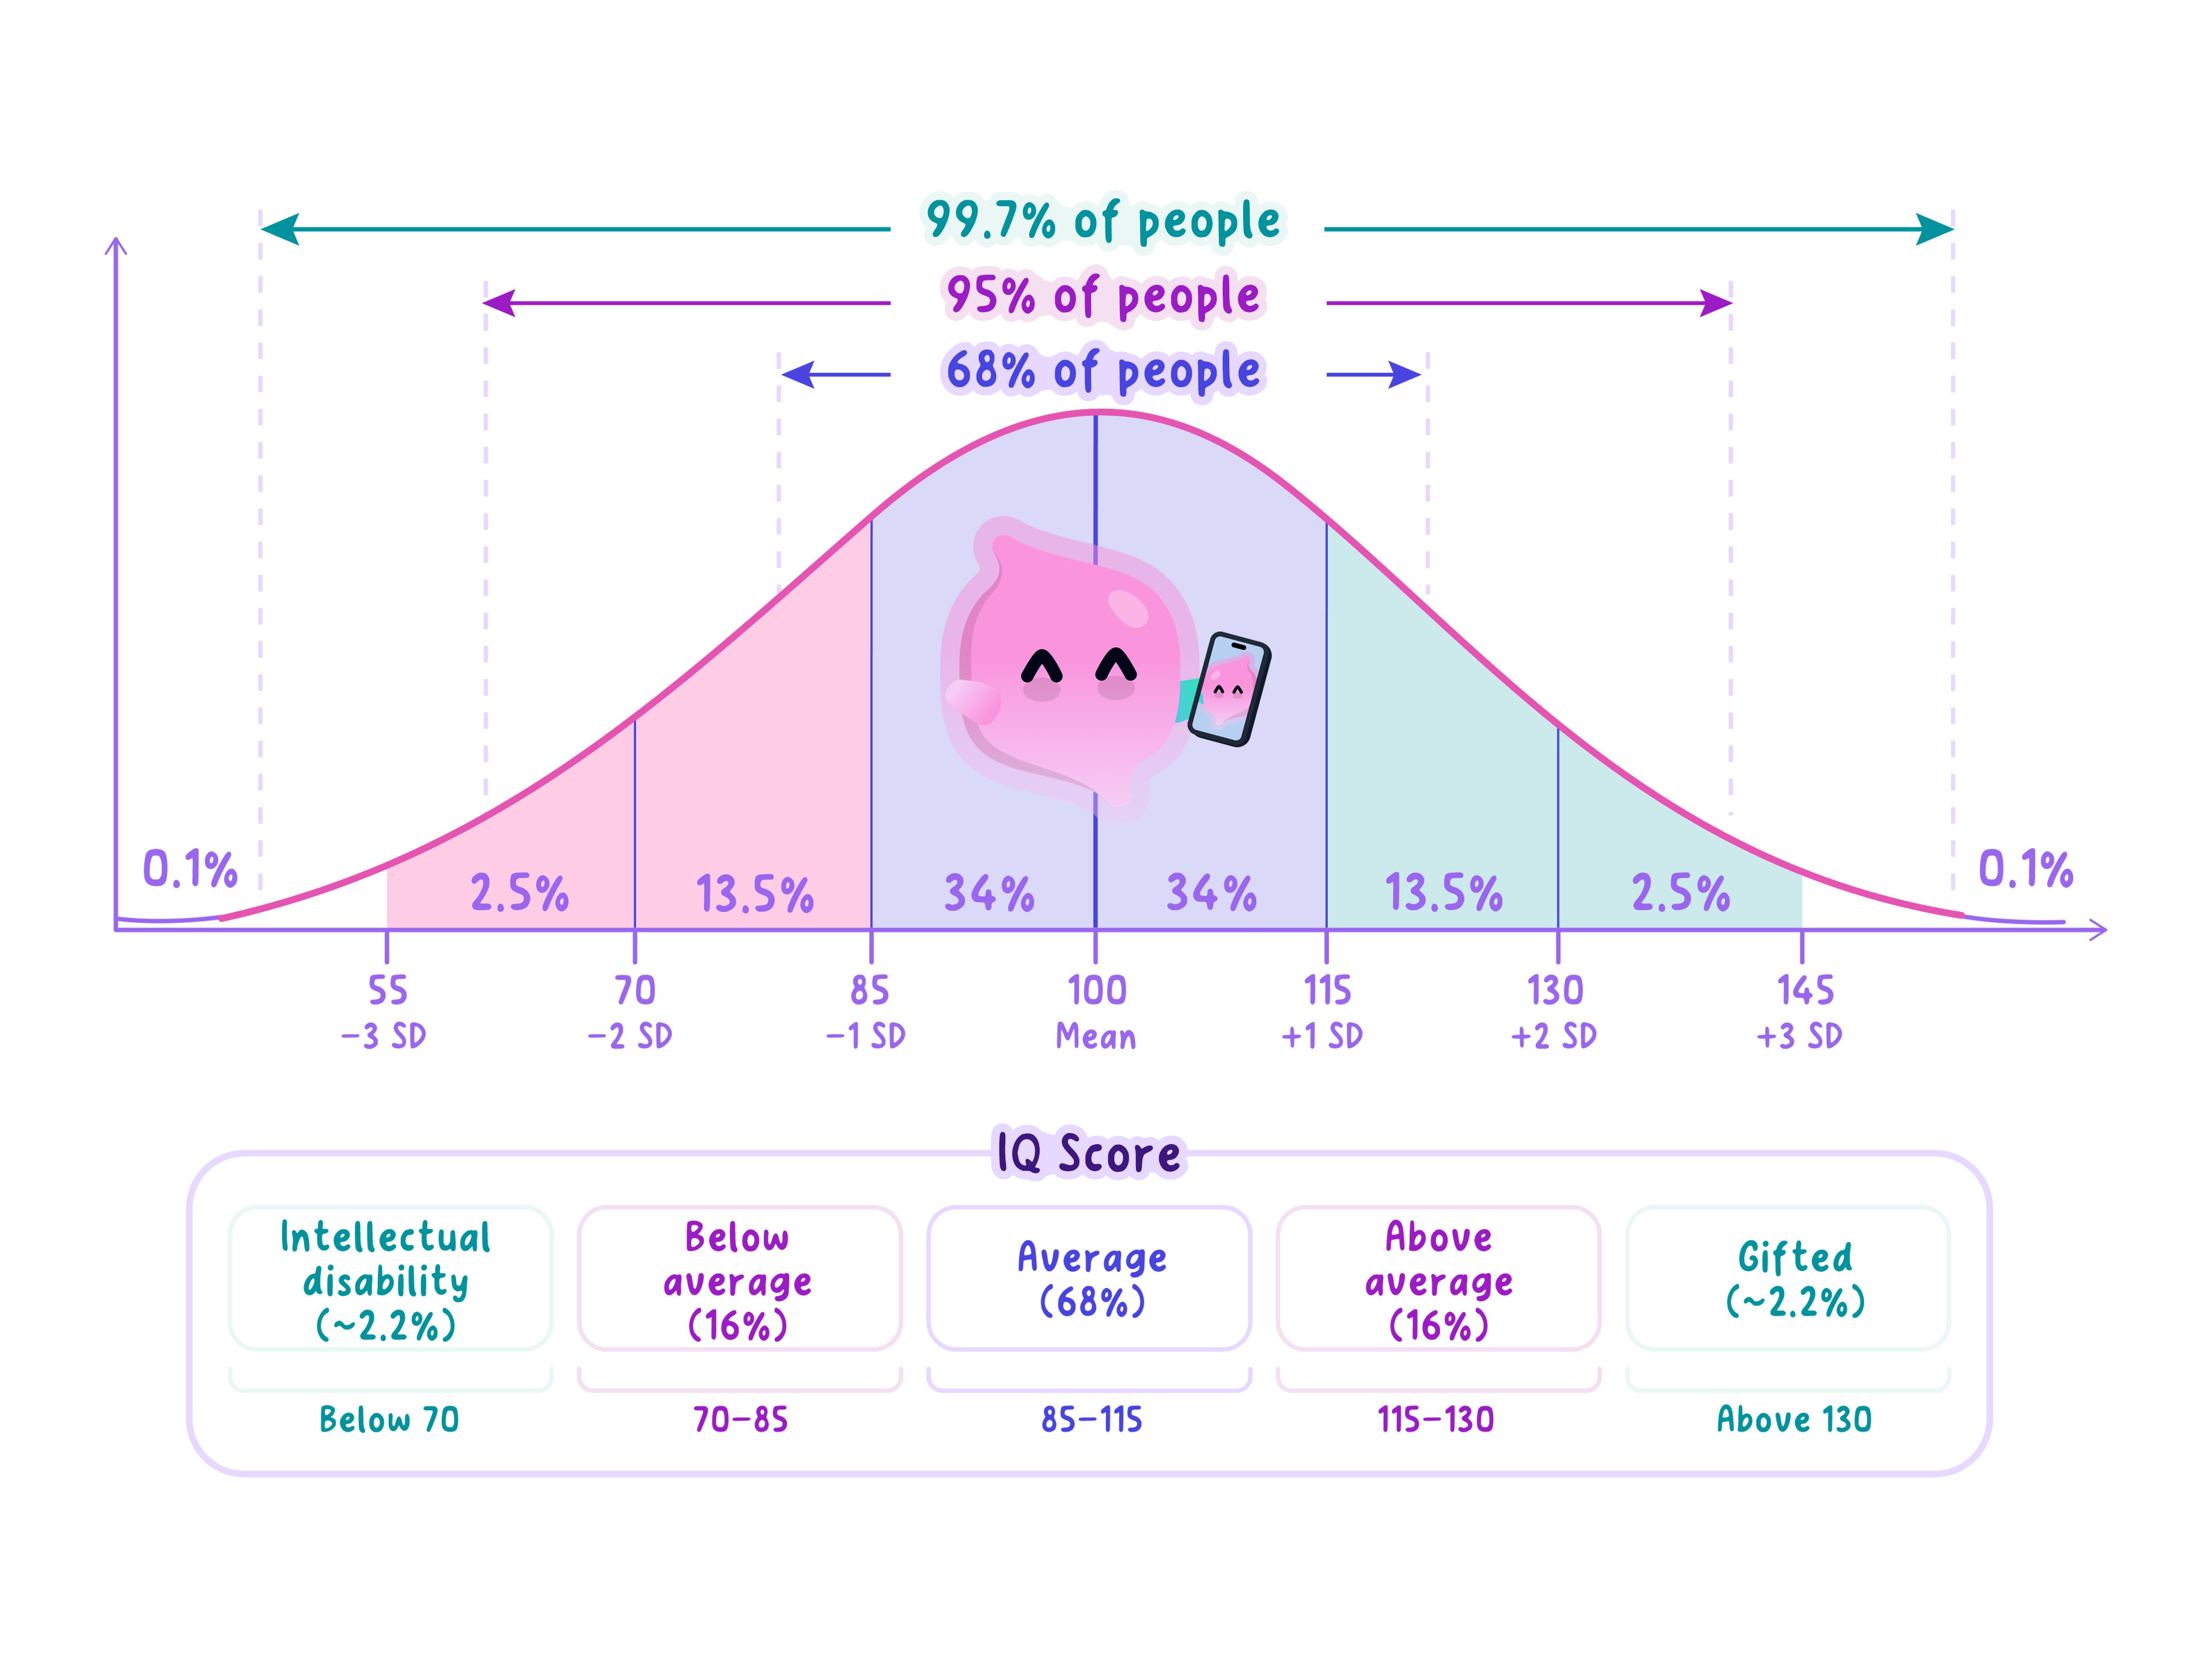
A symmetrical, bell-shaped spread of data in which most values cluster around the middle and fewer lie at each extreme, so the mean, median and mode all fall at the centre.
- Drawn as a curve, a normal distribution is bell-shaped with a single peak.
- It is symmetrical, so the left half is a mirror image of the right half.
- Most values cluster around the middle, and the number of values falls away steadily towards each extreme.
- The mean, the median and the mode are all equal and all sit at the centre, directly under the peak.
Turning this into marks
- Write out the total and the division line by line, and attach the unit to the answer.
- Asked which measure to use, say what it is about this data that makes your choice the right one.
- The mark most often lost on a normal distribution is naming only the bell shape, without the symmetry and the three averages meeting at the centre.
Self review
- Find the mean, median, mode and range of 6, 8, 8, 9, 12 and 13, showing your working.
- Nine of 30 pupils gave the right answer, so express that as a simplified fraction, a percentage and a ratio of right to wrong.
- One pupil in a set of six revised for four hours while the rest revised for under thirty minutes, so which measure of central tendency should you report and why?
- Give three characteristics of a normal distribution.
