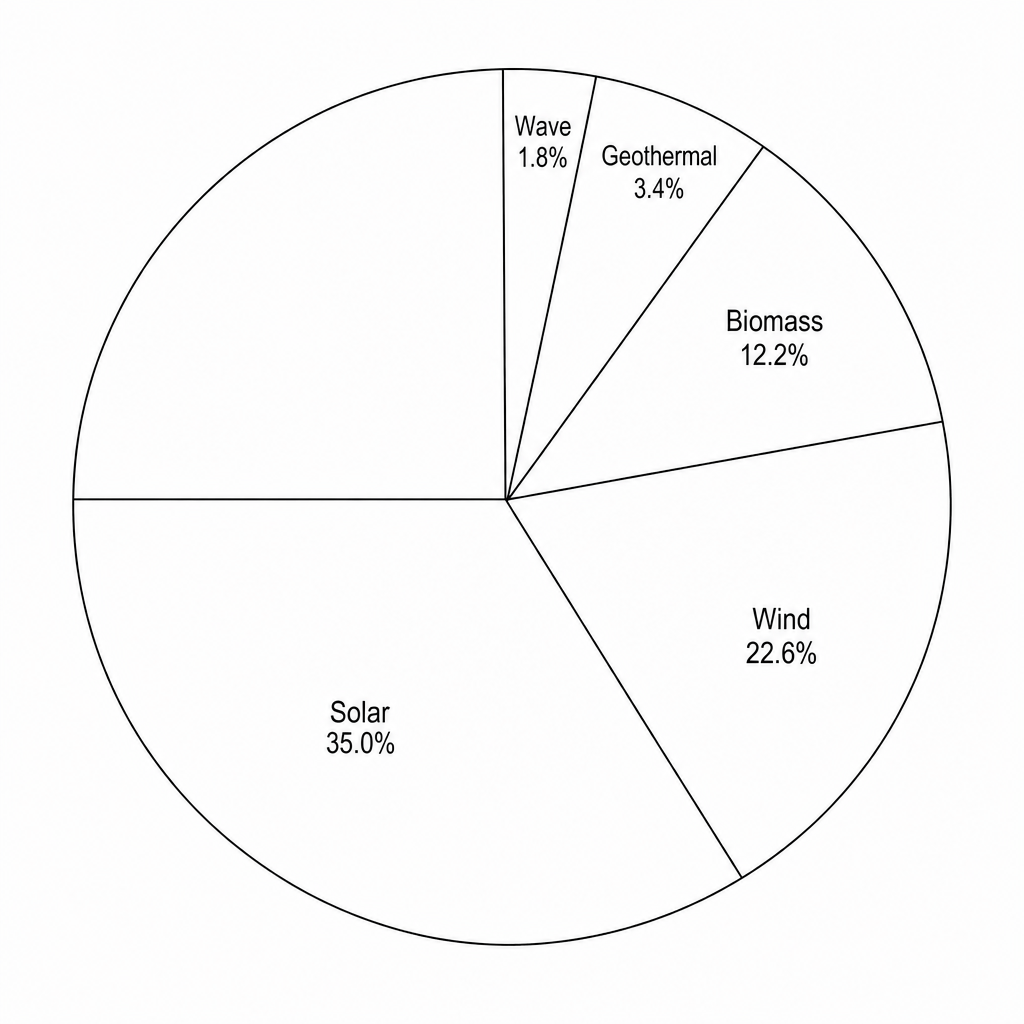
The pie chart shows how electricity was generated in a coastal region in 2030.
a.[1]
Which two energy resources generated the least electricity in 2030?
b.[2]
Estimate the percentage of electricity generated using nuclear power in 2030.
c.[3]
From 2030 to 2031, the percentage of electricity generated using wind power changed from 22.6%22.6\%22.6% to 25.1%25.1\%25.1%.
Calculate the percentage change in the use of wind power. Use the equation: percentage change=new value−old valueold value×100%\text{percentage change} = \frac{\text{new value} - \text{old value}}{\text{old value}} \times 100\%percentage change=old valuenew value−old value×100% Give your answer to 1 decimal place.