Powering Earth

EasyMediumHard
1234567
Question 6
Hard

Some policy makers suggest that the UK should try to generate the majority of its electrical power from solar energy.

Fig. 1.1 shows the total electrical power generated by solar panels across the UK on a clear, sunny summer day.
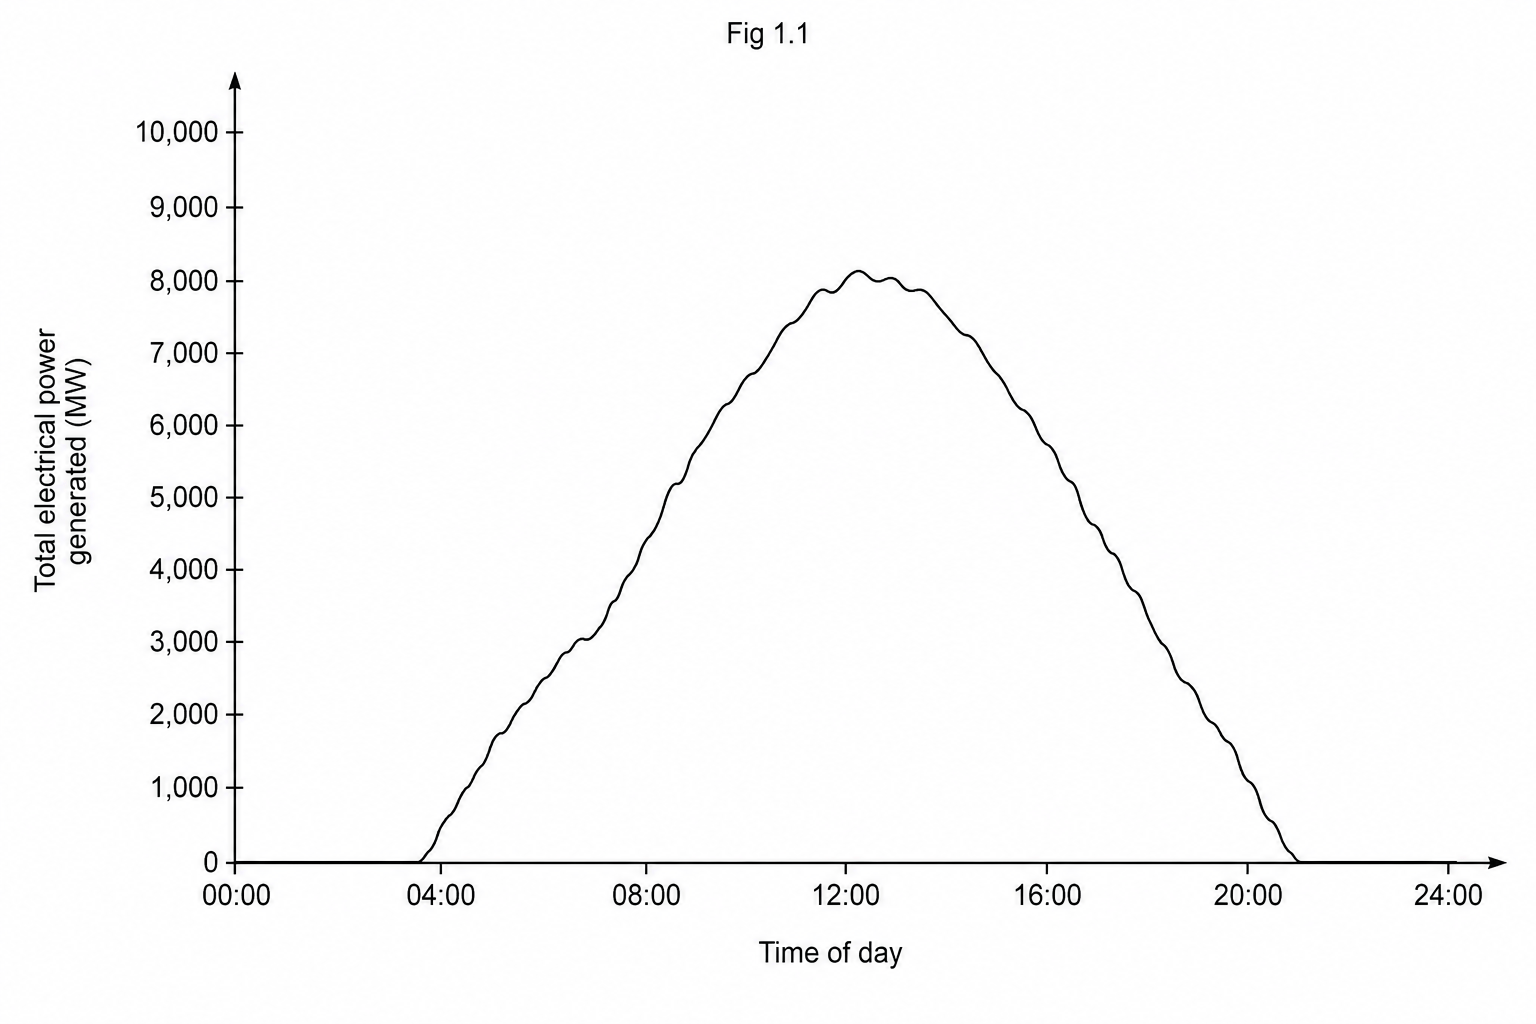
A line graph titled Fig 1.1 showing total electrical power generated by solar panels in MW against Time of day on a sunny summer day. The x-axis spans 24 hours from 0:00 to 0:00, marked every 4 hours. The y-axis represents total electrical power generated by solar panels, from 0 to 10,000 MW in intervals of 1,000 MW. The curve starts at 0 MW from 0:00 until 5:00. It then rises steadily, passing through 3,000 MW at 8:00, peaking at 8,000 MW around 13:00, before falling steadily back to 0 MW by 21:00 and remaining at 0 MW until midnight. There are small fluctuations on the curve representing minor variations in sunlight.

Fig. 1.2 shows the total public demand for electrical power in the UK on the same summer day.
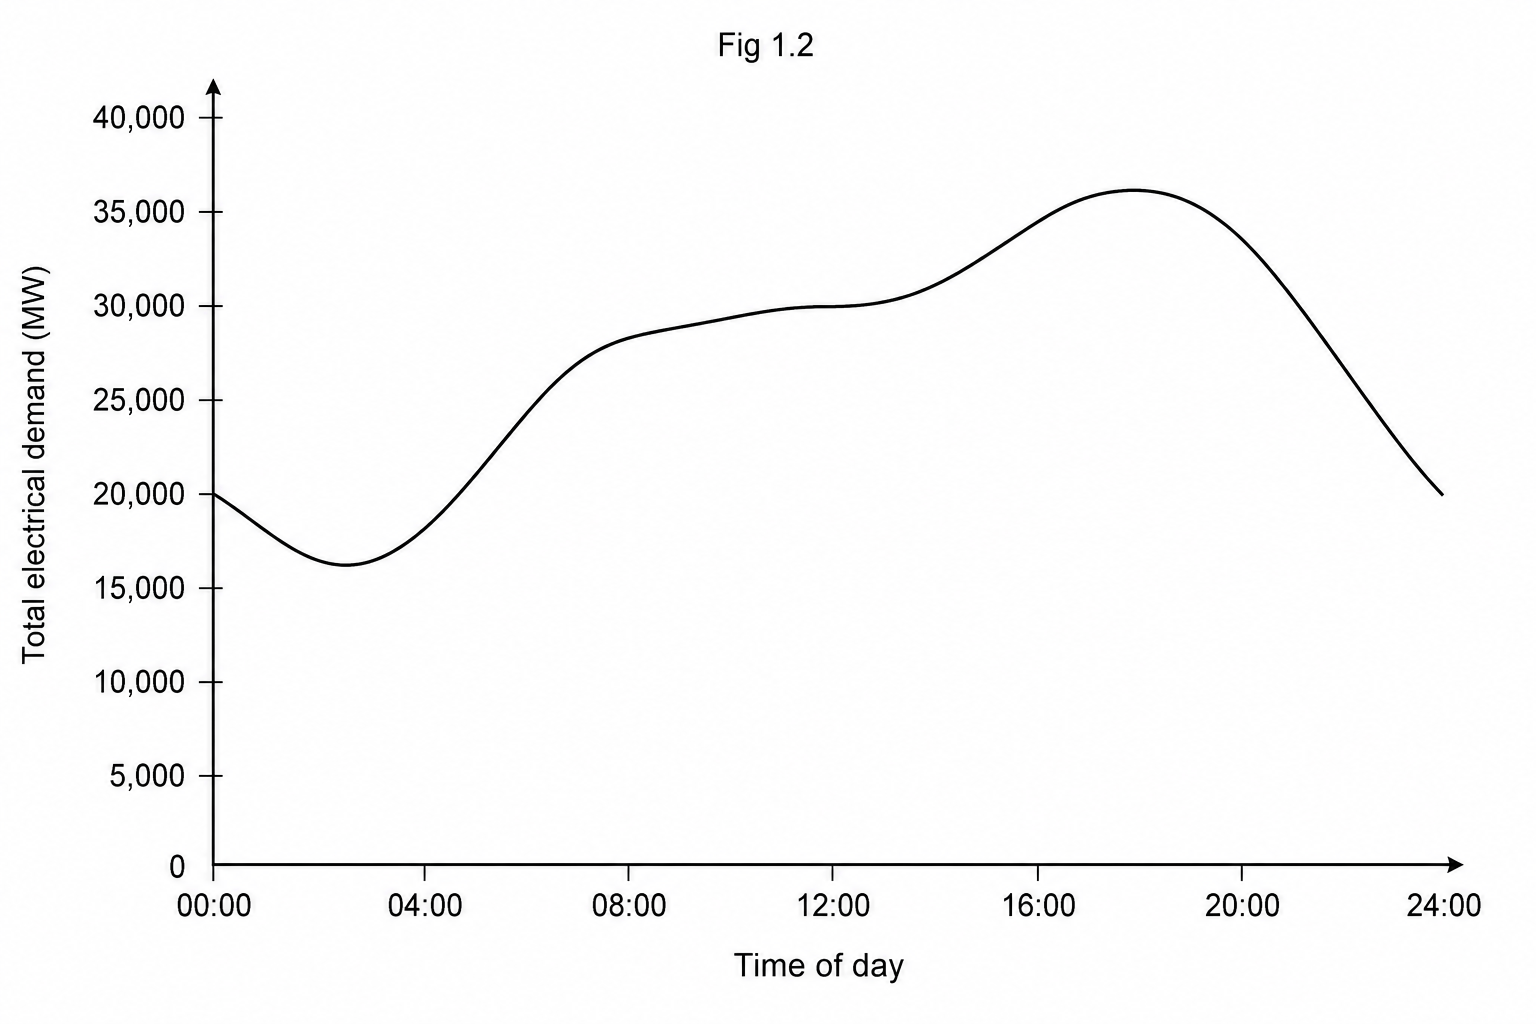
A line graph titled Fig 1.2 showing total electrical demand in MW against Time of day. The x-axis spans 24 hours from 0:00 to 0:00, marked every 4 hours. The y-axis represents total demand for electrical power, ranging from 0 to 40,000 MW in intervals of 5,000 MW. The curve starts at 20,000 MW at 0:00, drops to a daily low of 16,000 MW at around 3:00, rises during the morning to about 28,000 MW at 8:00, plateaus around 30,000 MW at midday, rises to a peak demand of 36,000 MW at around 18:00, and then declines back to 20,000 MW by 24:00.

Evaluate the advantages and disadvantages of trying to meet most of the UK's electrical demand using solar energy.

Use information from Fig. 1.1 and Fig. 1.2, and your own scientific knowledge, to support your answer.

[6]

Powering Earth Questions

  1. GCSE
  2. /Physics
  3. /Powering Earth