The graph below shows the speed-time graph for Car A. The driver of Car A reacts to an obstacle at time t=0.00 st = 0.00 \text{ s}t=0.00 s, then applies the brakes at t=0.60 st = 0.60 \text{ s}t=0.60 s.
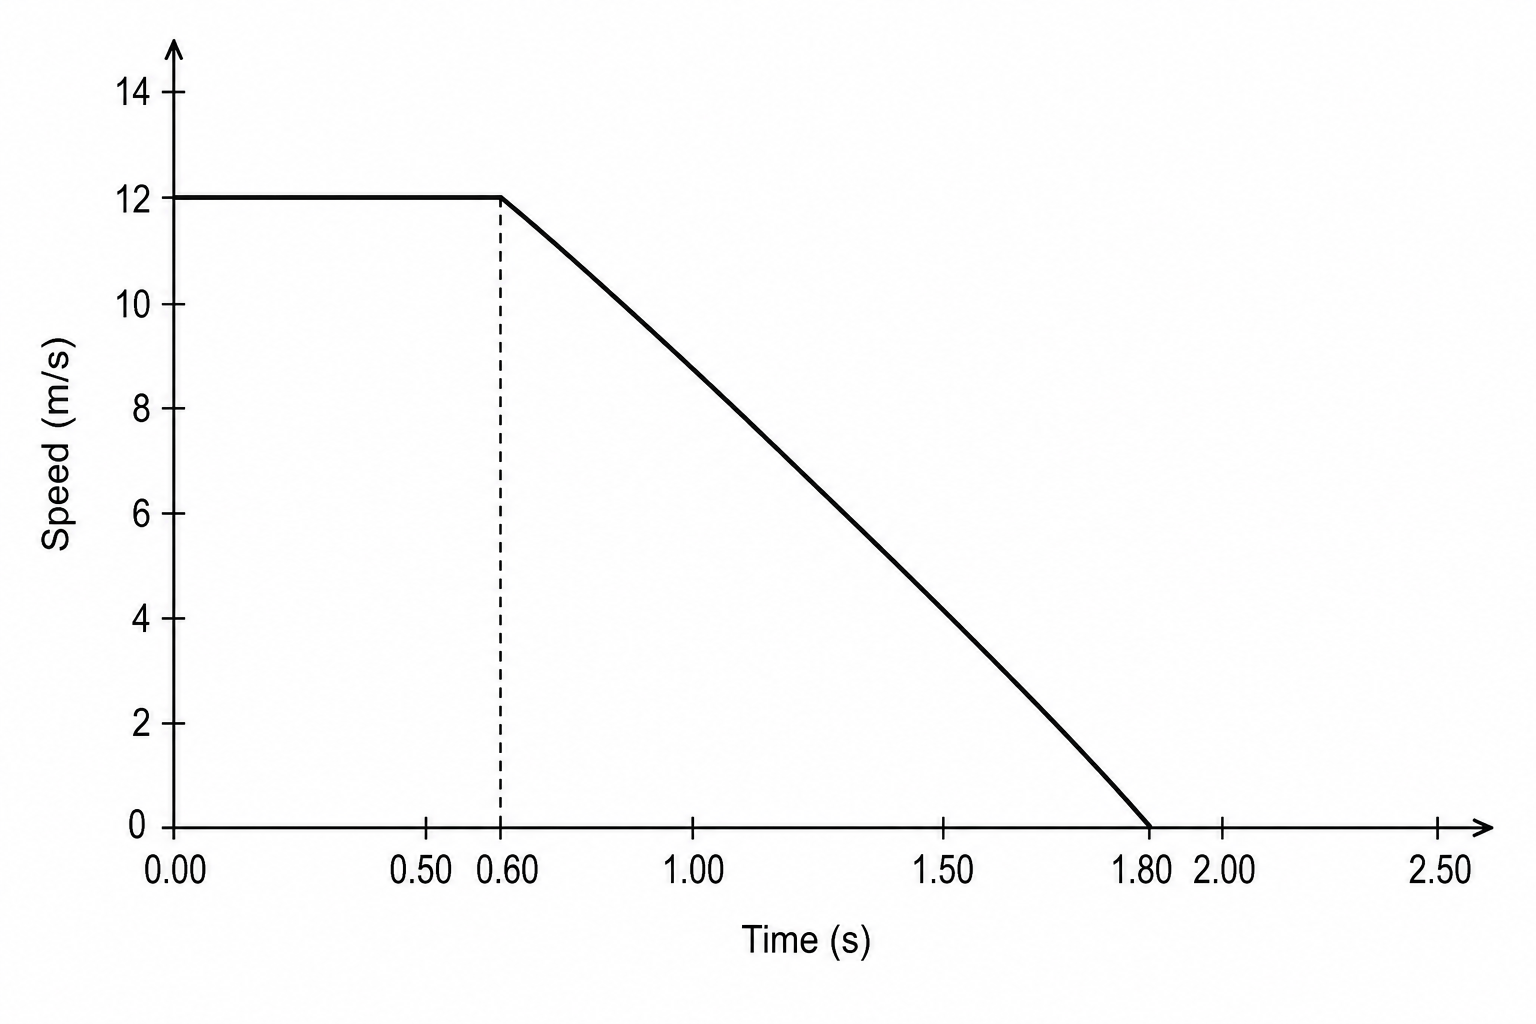
Show that the thinking distance is equal to the braking distance for Car A by calculating both values from the graph.
Another car, Car B, is also travelling at 12 m/s12 \text{ m/s}12 m/s. Its driver has a longer reaction time and applies the brakes at t=0.90 st = 0.90 \text{ s}t=0.90 s. Car B decelerates at the same rate as Car A. Determine the total stopping distance of Car B.
The reaction time of a driver can be measured using a standard 30 cm30\text{ cm}30 cm ruler.
Explain how a ruler can be used to estimate reaction time.
State one precaution that must be taken to ensure the measurements are accurate and reliable.