Distance-time graphs
Definition
Distance-time graph
A graph of the distance an object has travelled from a starting point plotted against time.
Definition
Gradient
The steepness of a line on a graph, equal to the change in the vertical quantity divided by the change in the horizontal quantity.
Definition
Tangent
A straight line that touches a curve at a single point and has the same gradient as the curve at that point.
- A distance-time graph shows the distance an object has travelled from its starting point on the vertical axis and the time on the horizontal axis.
- The gradient of a line is its steepness, found by dividing the change in the vertical quantity by the change in the horizontal quantity.
- On a distance-time graph the gradient is the change in distance divided by the change in time, which is the speed of the object.
- The shape of the line therefore shows how the object is moving.
- A horizontal line has a gradient of zero, so the object is stationary because its distance is not changing.
- A straight sloping line has a constant gradient, so the object moves at a constant speed and covers equal distances in equal times.
- A steeper straight line shows a greater speed, because more distance is covered in each second.
- A curve that gets steeper shows the object speeding up, because the gradient increases as time passes.
- A curve that becomes less steep shows the object slowing down, because the gradient decreases as time passes.
- When the vertical axis shows the distance from a fixed starting point, a line that slopes downwards shows the object travelling back towards the start.
- To find the gradient of a straight line, choose two points far apart on it, read the change in distance and the change in time between them, and divide the first by the second.
- The speed at one instant on a curved line is found by drawing a tangent to the curve at that instant and calculating the gradient of the tangent.
Example
Speed from a distance-time graph
- A distance-time graph for a cyclist is a straight line through the points (0 s, 0 m)(0\ \text{s},\ 0\ \text{m})(0 s, 0 m) and (40 s, 200 m)(40\ \text{s},\ 200\ \text{m})(40 s, 200 m).
- Find the change in distance and the change in time between the two points:
- Divide to find the gradient:
- The gradient of the line, and so the cyclist's speed, is 5.0 m/s5.0\ \text{m/s}5.0 m/s.
Example
Speed from a tangent
- A curved distance-time graph shows a car pulling away from traffic lights, and its speed at t=6 st=6\ \text{s}t=6 s is needed.
- A tangent drawn to the curve at t=6 st=6\ \text{s}t=6 s passes through (3 s, 0 m)(3\ \text{s},\ 0\ \text{m})(3 s, 0 m) and (11 s, 64 m)(11\ \text{s},\ 64\ \text{m})(11 s, 64 m).
- The gradient of the tangent gives the speed at that instant:
- The car is moving at 8.0 m/s8.0\ \text{m/s}8.0 m/s at the instant t=6 st=6\ \text{s}t=6 s.
Velocity-time graphs
Definition
Velocity-time graph
A graph of the velocity of an object plotted against time.
Definition
Acceleration
The rate of change of velocity.
Definition
Deceleration
A negative acceleration, in which the velocity of an object decreases.
- A velocity-time graph shows the velocity of an object on the vertical axis and the time on the horizontal axis.
- Acceleration is the change in velocity in each second, so its unit is metres per second squared (m/s2\text{m/s}^2m/s2).
- On a velocity-time graph the gradient is the change in velocity divided by the change in time, which is the acceleration of the object.
- The shape of the line shows how the velocity is changing.
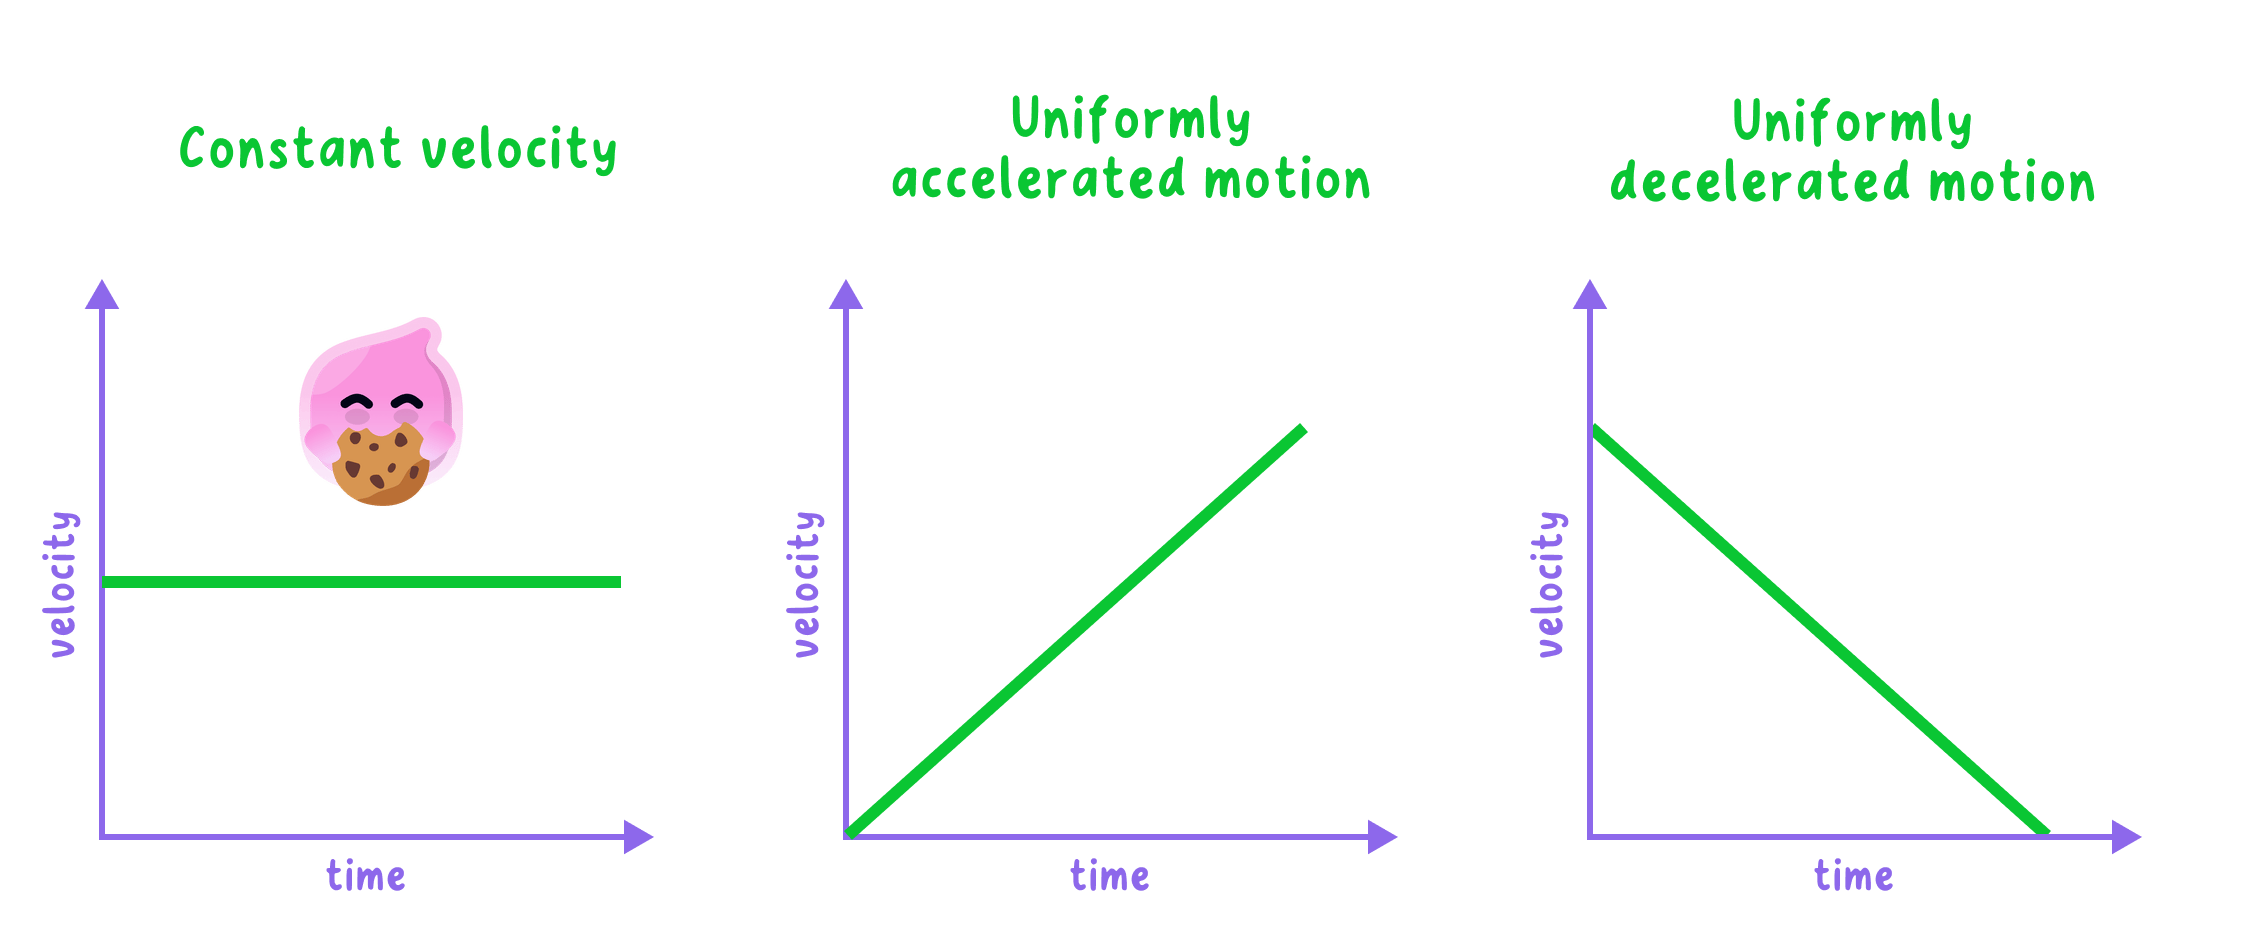
- A horizontal line above the time axis shows a constant velocity, because the velocity is not changing and the acceleration is zero.
- A horizontal line along the time axis shows an object that is stationary, because its velocity is zero.
- A straight line sloping upwards shows a constant acceleration, because the velocity increases by the same amount every second.
- A straight line sloping downwards shows a constant deceleration, because the velocity decreases by the same amount every second and the gradient is negative.
- A steeper line shows a greater acceleration or deceleration.
- A curved line shows that the acceleration itself is changing, and the acceleration at one instant is the gradient of a tangent drawn at that instant.
- Velocity is a vector, so a line that drops below the time axis shows the object moving in the opposite direction.
Example
Acceleration from a velocity-time graph
- A velocity-time graph for a bus leaving a stop is a straight line from 0 m/s0\ \text{m/s}0 m/s at 0 s0\ \text{s}0 s to 12 m/s12\ \text{m/s}12 m/s at 8 s8\ \text{s}8 s.
- The gradient is the change in velocity divided by the change in time:
- Later the line falls from 12 m/s12\ \text{m/s}12 m/s to 0 m/s0\ \text{m/s}0 m/s in 4 s4\ \text{s}4 s as the bus pulls in at the next stop:
- The bus accelerates at 1.5 m/s21.5\ \text{m/s}^21.5 m/s2, and the negative gradient shows that it later decelerates at 3.0 m/s23.0\ \text{m/s}^23.0 m/s2.
Describing a journey from its graphs
- The same journey can be drawn on both kinds of graph, and each section of one graph matches a section of the other.
- Walking at a steady speed gives a straight sloping line on a distance-time graph and a horizontal line above the axis on a velocity-time graph.
- Waiting at a bus stop gives a horizontal line on a distance-time graph and a line along the time axis on a velocity-time graph.
- A bus pulling away gives a curve that gets steeper on a distance-time graph and a line sloping upwards on a velocity-time graph.
- A bus braking to a stop gives a curve that levels off on a distance-time graph and a line sloping down to the axis on a velocity-time graph.
- To compare two sections of a journey, compare their gradients, since the steeper section of a distance-time graph is the faster one and the steeper section of a velocity-time graph has the larger acceleration.
- Values can also be read straight from either graph, such as the time at which an object stops or the greatest velocity it reaches.
- The labels on the axes always decide how a graph is read, so check the quantity on the vertical axis before interpreting any line.
Practical
Graphs of a journey to school
- Aim: to record a real journey to school and present it as a distance-time graph and a velocity-time graph.
- Apparatus: a smartphone with a GPS tracking app or a watch with a stopwatch function, an online map with a distance-measuring tool, a notebook, a ruler and graph paper or a spreadsheet.
- Method:
- Plan the route and split it into stages wherever the type of movement changes, such as walking to the bus stop, waiting, riding the bus and walking from the bus stop to the school gate.
- Measure the length of each moving stage on the online map, or let the tracking app record the distance automatically.
- Start the stopwatch as you leave home and write down the time shown at the end of every stage, including the moment the bus arrives and the moment you step off.
- Add up the stage distances so that you know the total distance from home at the end of each stage.
- Plot the total distance on the vertical axis against time on the horizontal axis, using a sloping straight line for each moving stage and a horizontal line for each wait.
- Calculate the speed for each moving stage by dividing its distance by its time.
- Draw the velocity-time graph by plotting each stage speed as a horizontal line lasting for the time of that stage, with every wait drawn along the time axis.
- Results: the distance-time graph has gentle slopes for the walks, a steeper slope for the bus ride and flat sections for every wait.
- Conclusion: the steepest stage of the distance-time graph matches the highest line on the velocity-time graph, because both show the fastest part of the journey.
- Watch out: treating each stage as a steady speed is only an approximation, because a bus speeds up and slows down many times between stops, and GPS readings can drift by several metres near tall buildings.
- Safety: keep your attention on traffic while you travel and write down times only when you have stopped somewhere safe.
Common Mistake
- Do not read a velocity-time graph as if it were a distance-time graph, because a horizontal line means constant velocity on one and no movement at all on the other.
- Do not say that an object on a downward-sloping velocity-time line is moving backwards, because it is still moving forwards while it slows down until the line reaches the axis.
- Do not find a gradient from two points close together, because a large triangle gives a more accurate value.
Exam technique
Interpreting graph shapes
- Name the feature of the graph and then state what it means for the motion, for example that the gradient is steeper so the speed is greater.
- Draw a large triangle on the line and show both changes when you calculate a gradient, because the working earns marks even if a reading is slightly off.
- Give every gradient its unit, which is m/s\text{m/s}m/s for a distance-time graph and m/s2\text{m/s}^2m/s2 for a velocity-time graph.
Self review
- State what the gradient of a distance-time graph represents.
- Describe the shape of a distance-time graph for an object moving at a constant speed.
- State what the gradient of a velocity-time graph represents and give its unit.
- Describe the velocity-time graph of an object that slows down at a steady rate until it stops.
- Explain how to find the speed at one instant from a curved distance-time graph.
