Area and distance travelled
Definition
Area under a velocity-time graph
The area between a velocity-time graph and the time axis, which represents the distance travelled by the object.
- The area between a velocity-time graph and the time axis represents the distance travelled by the object during that time.
- This works because distance equals velocity multiplied by time, and on the graph the velocity is the height of the area while the time is its width.
- The units confirm the idea, because a velocity in m/s\text{m/s}m/s multiplied by a time in s\text{s}s gives a distance in m\text{m}m.
- For a constant velocity the line is horizontal, so the area underneath it is a rectangle with a height equal to the velocity and a width equal to the time.
- A car moving at a steady 15 m/s15\ \text{m/s}15 m/s for 6 s6\ \text{s}6 s covers 15×6=90 m15\times6=90\ \text{m}15×6=90 m, which is the area of the rectangle under its line.
- For a uniform acceleration from rest the line slopes up from the origin, so the area underneath it is a triangle.
- The area of a triangle is 12×base×height\dfrac{1}{2}\times\text{base}\times\text{height}21×base×height, where the base is the time and the height is the final velocity.
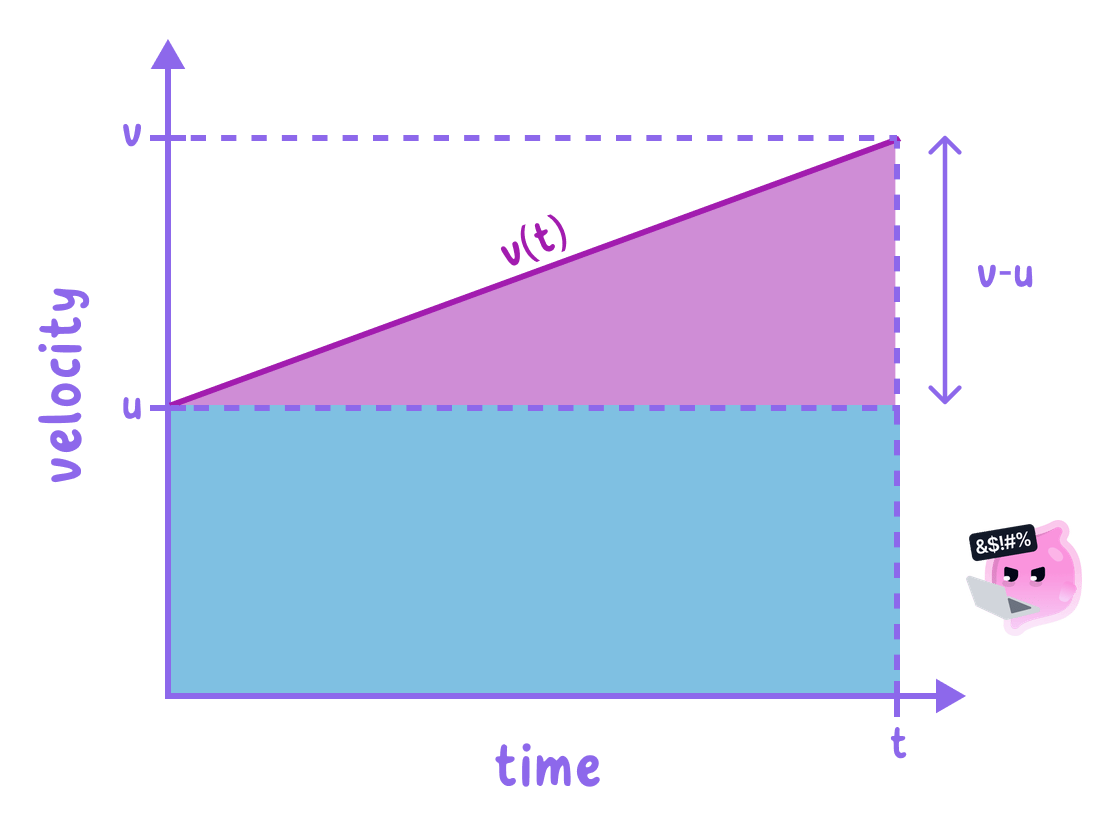
- For a uniform acceleration between two velocities the area is a trapezium, which can be split into a rectangle under the starting velocity and a triangle on top of it.
- The trapezium can also be found in one step as 12×(initial velocity+final velocity)×time\dfrac{1}{2}\times(\text{initial velocity}+\text{final velocity})\times\text{time}21×(initial velocity+final velocity)×time.
- A journey with several stages is split into sections, the area of each section is found, and the areas are added to give the total distance.
- The gradient and the area give two different quantities from the same graph, because the gradient gives the acceleration while the area gives the distance.
Example
Distance for a three-stage journey
- A tram accelerates uniformly from rest to 10 m/s10\ \text{m/s}10 m/s in 5 s5\ \text{s}5 s, travels at 10 m/s10\ \text{m/s}10 m/s for 20 s20\ \text{s}20 s and then slows uniformly to rest in 4 s4\ \text{s}4 s.
- The first section of the graph is a triangle:
- The middle section is a rectangle:
- The last section is another triangle:
- Adding the three areas gives the total distance:
- The tram travels 245 m245\ \text{m}245 m between the two stops.
Example
Area of a trapezium
- A cyclist speeds up uniformly from 4 m/s4\ \text{m/s}4 m/s to 10 m/s10\ \text{m/s}10 m/s in 6 s6\ \text{s}6 s.
- The rectangle under the starting velocity has an area of:
- The triangle on top has a height of 10−4=6 m/s10-4=6\ \text{m/s}10−4=6 m/s, so its area is:
- The total distance is 24 m+18 m=42 m24\ \text{m}+18\ \text{m}=42\ \text{m}24 m+18 m=42 m, which matches 12×(4+10)×6=42 m\dfrac{1}{2}\times(4+10)\times6=42\ \text{m}21×(4+10)×6=42 m from the trapezium formula.
Curved lines and counting squares
- When the line is curved, the area under it cannot be split exactly into simple shapes, so it is estimated by counting the squares of the grid.
- First work out the distance that one grid square represents by multiplying the velocity of its height by the time of its width.
- Next count every whole square under the line, count each square that is half or more under the line as one square, and ignore each square that is less than half under it.
- Multiplying the number of squares by the distance per square gives an estimate of the total distance.
- A finer grid gives a better estimate, because less of the area is wrongly gained or lost along the edge of the curve.
- Another method replaces the curve with a few straight lines joining points on it, which turns the area into triangles and trapezia that are quick to calculate.
Example
Estimating distance by counting squares
- On a velocity-time graph, each grid square is 1 m/s1\ \text{m/s}1 m/s high and 2 s2\ \text{s}2 s wide.
- The distance represented by one square is:
- There are 343434 whole squares under the curve and 888 more squares that are at least half under it, giving 424242 squares in total.
- The estimated distance is:
Areas below the time axis
Definition
Displacement
The straight-line distance from an object's starting point to its finishing point, together with its direction.
- Velocity is a vector, so a section of a velocity-time graph below the time axis shows the object moving in the opposite direction.
- An area above the axis represents a displacement in the positive direction, and an area below the axis represents a displacement in the negative direction.
- The total distance travelled is found by adding the sizes of all the areas, treating every area as positive.
- The overall displacement is found by giving areas below the axis a negative sign before adding, so these areas cancel part of the areas above the axis.
- For example, a ball rolled up a slope that rolls back down past its starting point could have an area of 6 m6\ \text{m}6 m above the axis and an area of 9 m9\ \text{m}9 m below it.
- The ball then travels a total distance of 6+9=15 m6+9=15\ \text{m}6+9=15 m but ends with a displacement of 6−9=−3 m6-9=-3\ \text{m}6−9=−3 m, which places it 3 m3\ \text{m}3 m below its starting point on the slope.
Common Mistake
- Do not use the gradient of a velocity-time graph when a question asks for a distance, because the distance comes from the area.
- Do not forget the 12\dfrac{1}{2}21 when you find the area of a triangle.
- Do not count squares without first checking the scale on both axes, because one square might stand for 2 s2\ \text{s}2 s or for 5 m/s5\ \text{m/s}5 m/s.
Exam technique
Finding distance from an area
- Divide the area into labelled shapes and write the area of each shape with its working, because each correct area can earn credit.
- Read the times and velocities at the corners of each shape carefully from the axes, since a misread value carries through every later step.
- Give the answer in metres, and when you count squares state both the number of squares and the distance that each one represents.
Self review
- State what the area under a velocity-time graph represents.
- Explain why the units of the area under a velocity-time graph are metres.
- Calculate the distance travelled by an object that accelerates uniformly from rest to 6 m/s6\ \text{m/s}6 m/s in 10 s10\ \text{s}10 s.
- Describe how to estimate the area under a curved velocity-time graph.
- Explain how distance and displacement are found differently when part of a velocity-time graph lies below the time axis.
