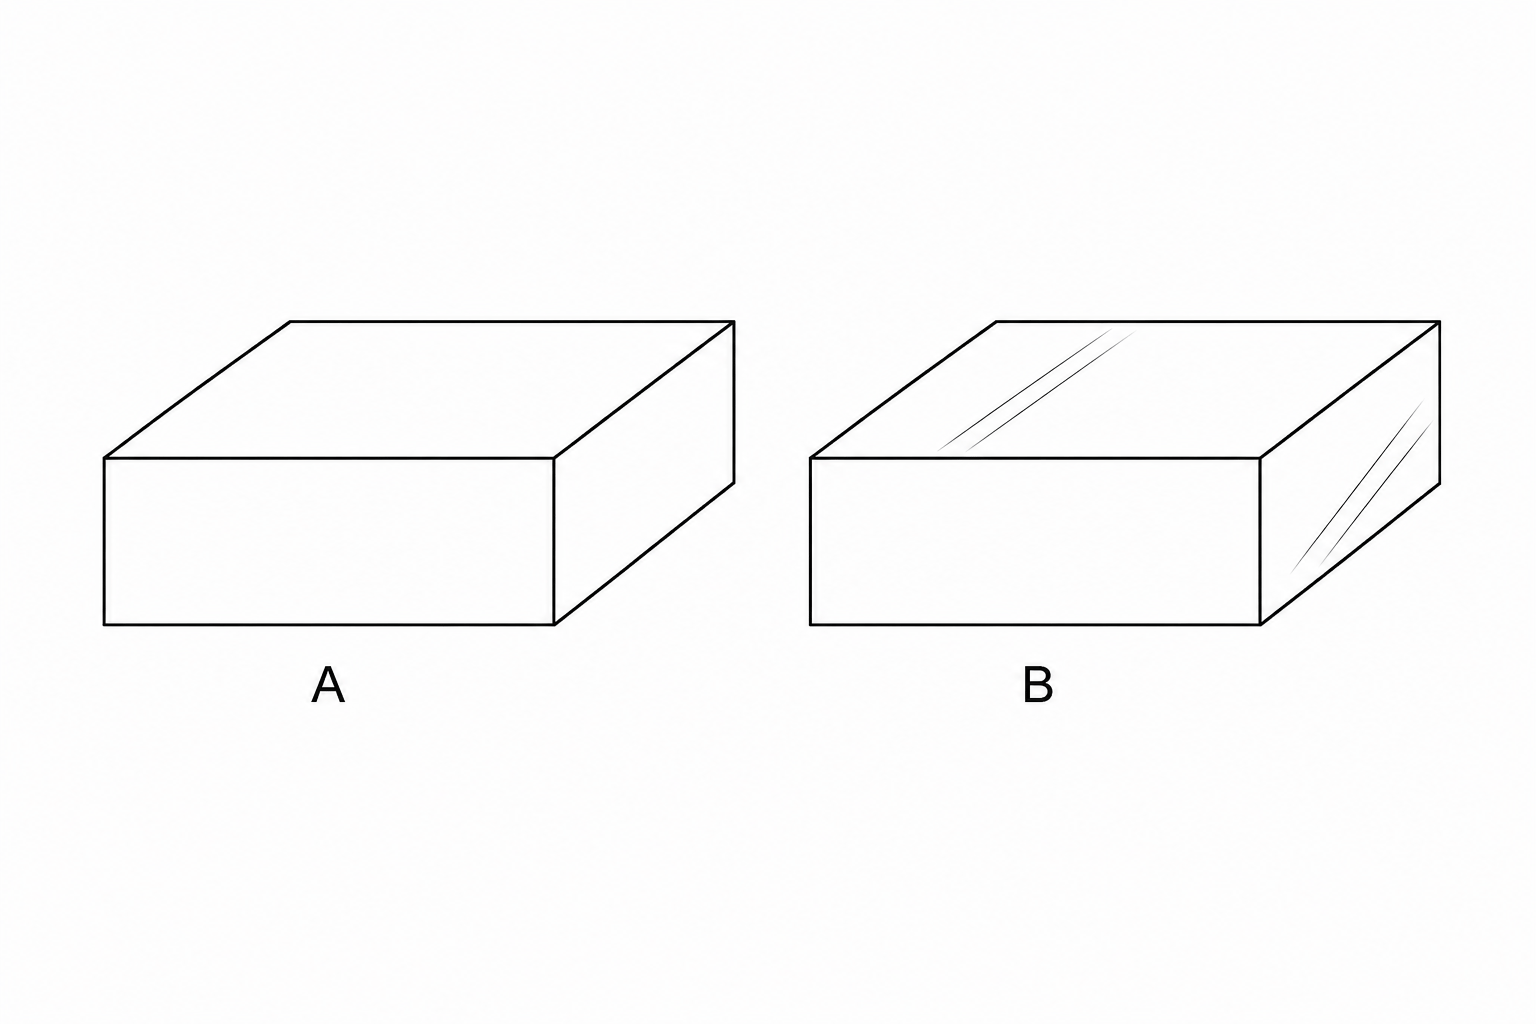
Figure 1 shows two solid metal blocks, A and B.
A and B are made from the same metal and have the exact same dimensions.
A is painted matte black and B is painted shiny silver.
Each block is heated to a different initial temperature. The blocks then cool in the same draft-free room.
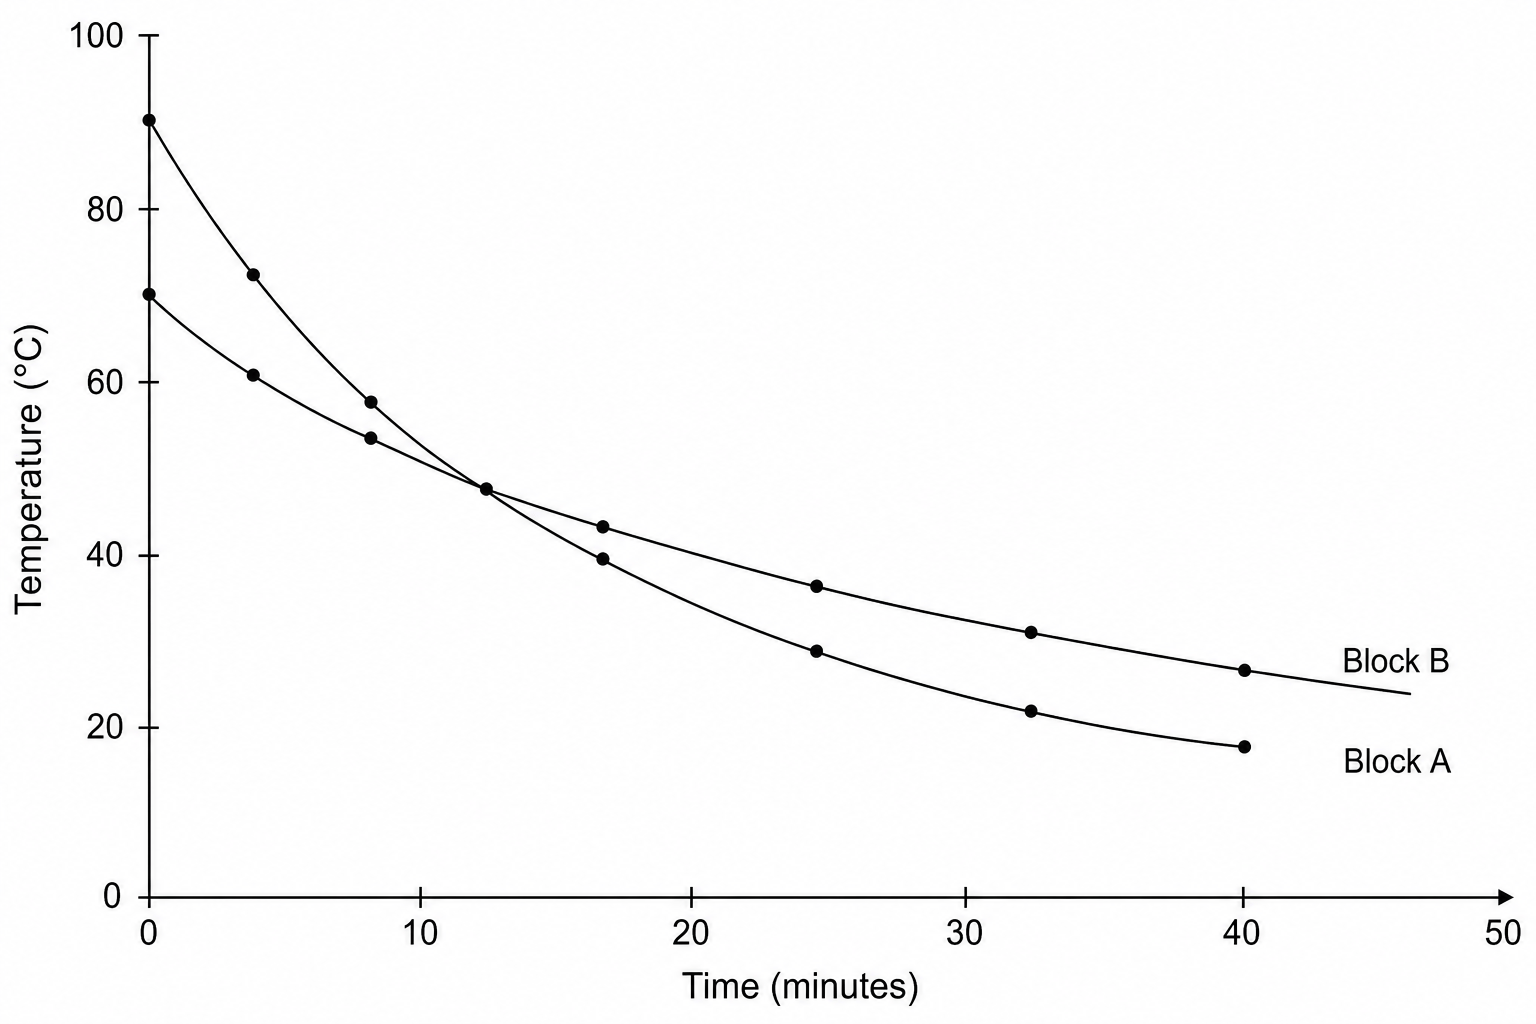
The graph in Figure 2 shows how the temperature of each block changes with time.
| Time (minutes) | Temperature of Block A (°C) | Temperature of Block B (°C) |
|---|---|---|
| 0 | 90 | 70 |
| 4 | 72 | 61 |
| 8 | 58 | 54 |
| 12 | 48 | 48 |
| 16 | 40 | 43 |
| 24 | 29 | 36 |
| 32 | 22 | 29 |
| 40 | 18 | 24 |
Use Figure 2 to determine the time when block A and block B were at the same temperature.
Show your working on the graph.