A student uses the circuit shown below to investigate how the electrical resistance R R\,R of a thin nickel wire varies with its length LLL. Nickel has a significant positive temperature coefficient of resistivity (its resistivity increases with temperature).
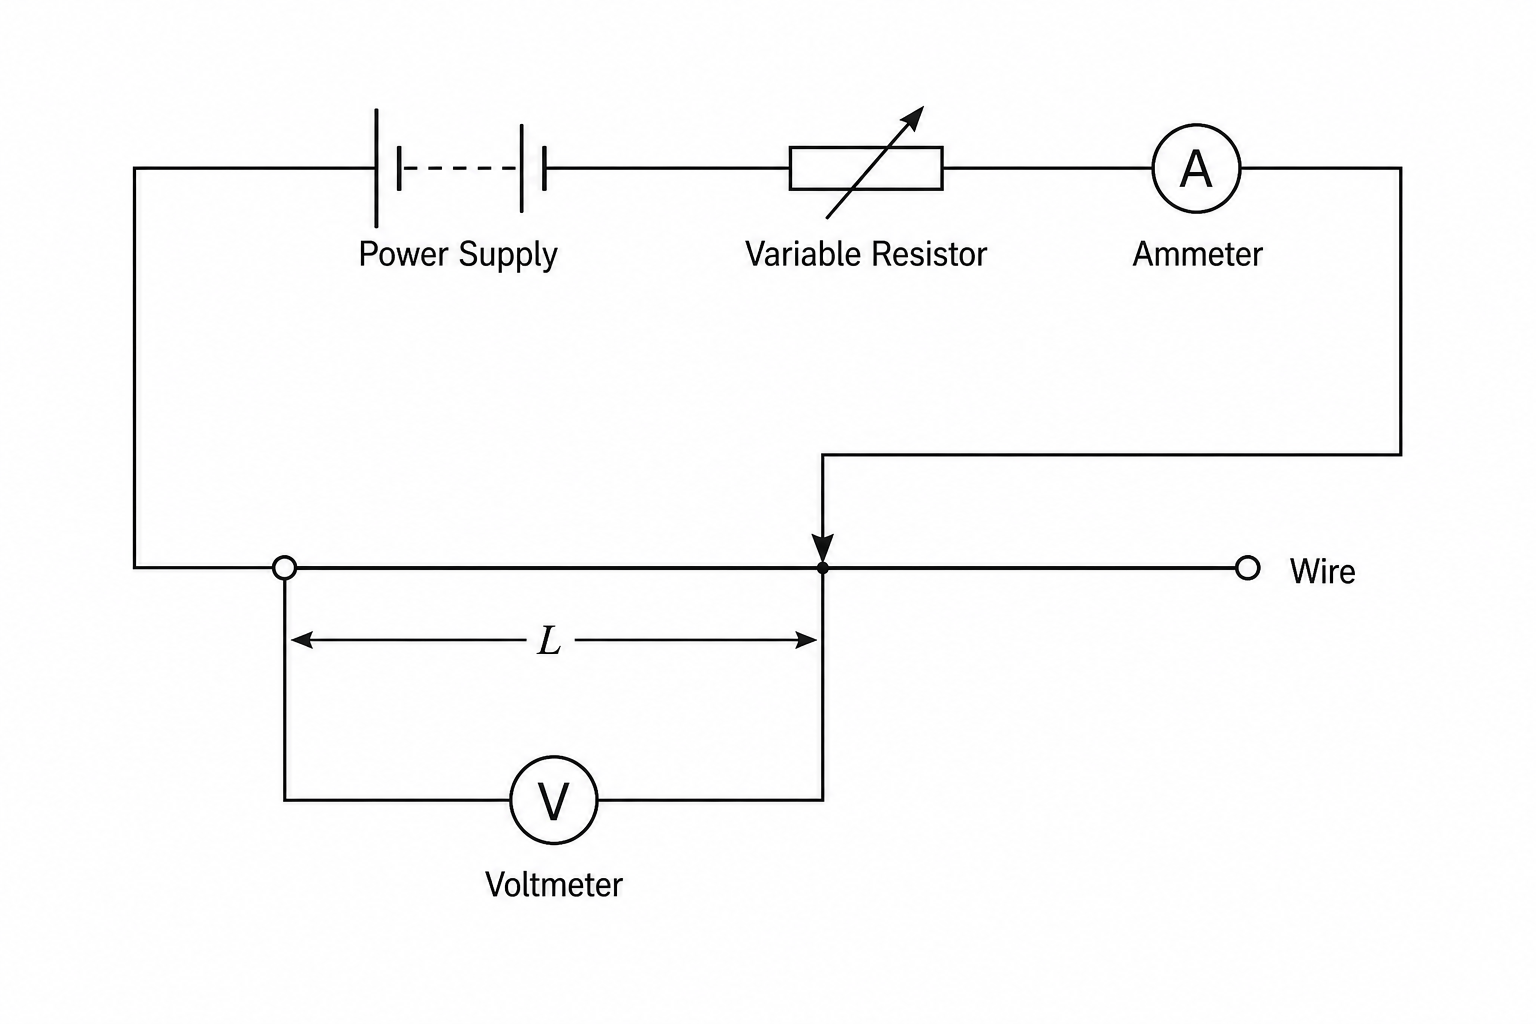
At each length LLL, the student uses the variable resistor to adjust the current to a constant value I I\,I before measuring the potential difference across the length of the wire.
However, the student does not switch off the current between readings, allowing the wire to reach a steady-state temperature for each measurement. Assuming that the rate of heat loss from the wire to the surroundings is proportional to both its surface area and its temperature rise above room temperature, how will the graph of measured resistance R R\,R against length L L\,L deviate from the ideal linear relationship obtained if the wire had remained at room temperature?
The graph remains linear but has a constant, steeper gradient than the ideal room-temperature line.
The gradient of the graph increases as LLL increases, causing the line to curve upwards.
The gradient of the graph decreases as LLL increases, causing the line to curve downwards.
The graph remains linear but has a constant, shallower gradient than the ideal room-temperature line.