Change 800 millilitres to litres
Change 50 kilograms to grams.
Here is a number machine.

Input ⟶\longrightarrow⟶ ×4\boxed{\times 4}×4 ⟶\longrightarrow⟶ −7\boxed{-7}−7 ⟶ \longrightarrow\,⟶ Output
What is the output when the input is 5?
What is the input when the output is 29?
Which is greater 24% of 140 or 31% of 110
You must show your working.
Write the ratio 25:40 25 : 40\,25:40 in its simplest form.
There are red shapes and blue shapes in a box, 58\displaystyle \frac{5}{8}85 of the shapes are red.
Write the ratio of red shapes to blue shapes.
On a map, the distance between Town A and Town B is 5 cm.
The scale is 1:50 0001:50\,0001:50000.
Find the real distance between Town A and Town B, in kilometres.
Stan has an income of £3000 a month.
He spends 25\displaystyle \frac{2}{5}52 of his income on rent.
He spends 415\displaystyle \frac{4}{15}154 of his income on bills.
He spends 110\displaystyle \frac{1}{10}101 of his income on food.
Stan saves the rest of his income.
Work out how much Stan saves each month.
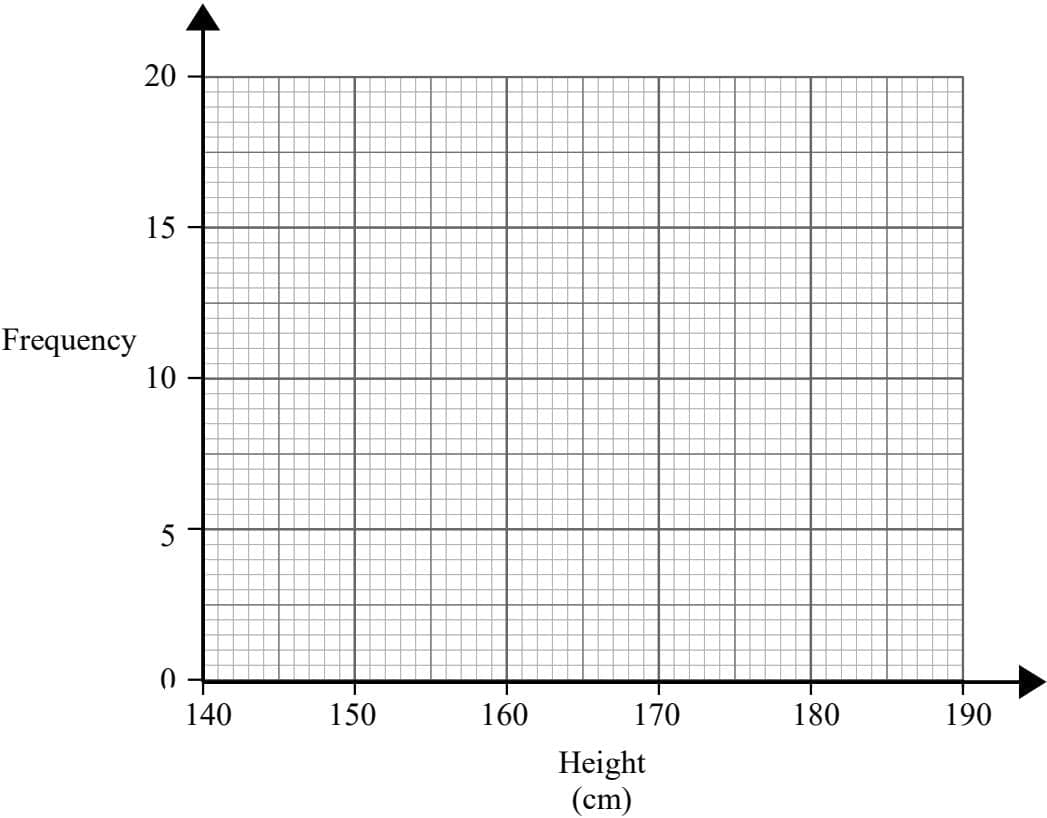
The frequency table shows the heights, in cm, of some tomato plants.
| Height (cm) | Frequency |
|---|---|
| 140<h≤150140 < h \leq 150140<h≤150 | 11 |
| 150<h≤160150 < h \leq 160150<h≤160 | 8 |
| 160<h≤170160 < h \leq 170160<h≤170 | 17 |
| 170<h≤180170 < h \leq 180170<h≤180 | 15 |
| 180<h≤190180 < h \leq 190180<h≤190 | 9 |
Draw a frequency polygon to show this information.
Work out 213+125\displaystyle 2\frac{1}{3} + 1\frac{2}{5}231+152
Work out 214÷35\displaystyle 2\frac{1}{4} \div \frac{3}{5}241÷53
Give your answer as a mixed number in its simplest form.
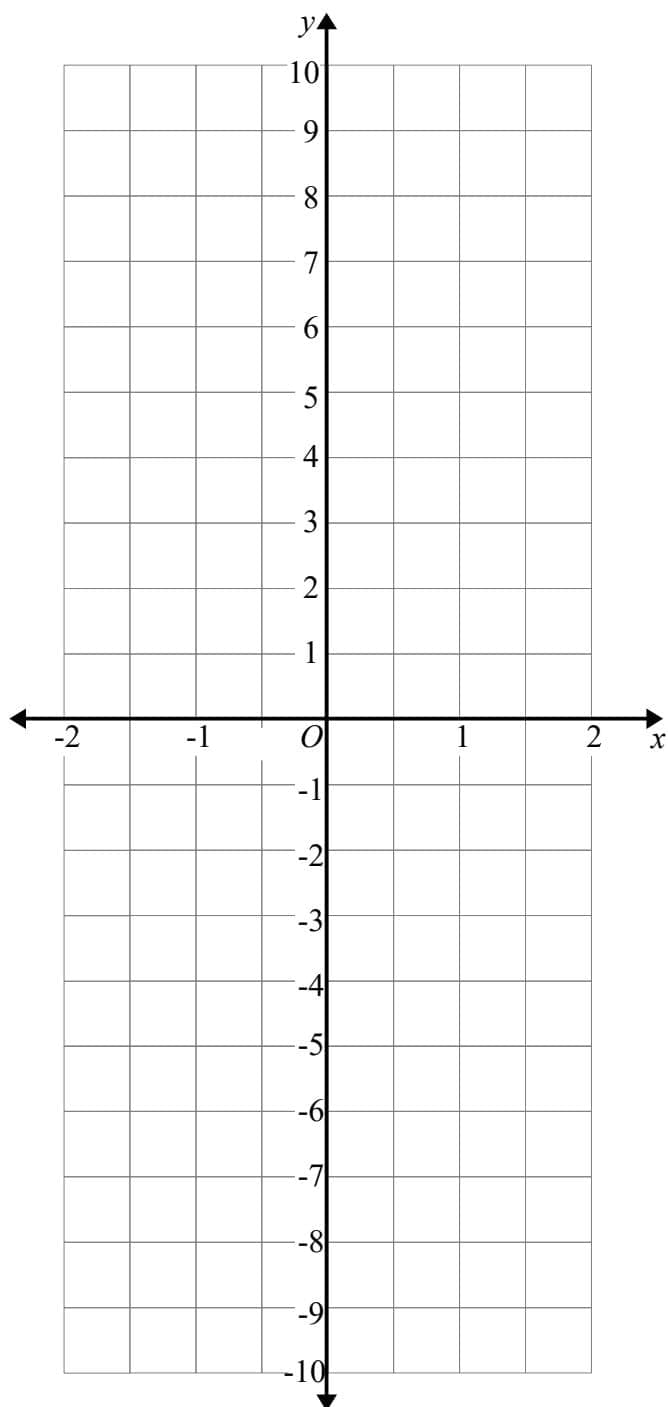
On the grid, draw the graph of y=2−3xy = 2 - 3xy=2−3x for values of x x\,x from -2 to 2